

10 Common Scams and How to Avoid Them

Lifestyle and Technology
January 07, 2020
Familiarize yourself with these common swindles, often targeting retirees.
As we age, we may become more susceptible to fraudsters who make a living preying on retirees. This can be especially true for widows and widowers who are making decisions alone and may be particularly trusting of friendly strangers. In order to protect ourselves and those we love, it’s important to be aware of the most common scams older Americans fall for.
1. Lottery scam
You get an unsolicited phone call or email saying you’ve won a large prize. All you need to do is send money to pay for shipping, taxes or some ancillary fee. You send the money, but the fictional prize never arrives.
2. Grandchild scam
Your grandchild calls to confess her troubles. Or so you think. It’s not uncommon for someone posing as your grandchild to call and, preying on your compassion, claim to be in a crisis situation and need money urgently. She may also beg you not to call her parents (which would give the scam away).
3. Charity scam
You donate to one charity and end up being on every charity list. That’s because they sell your name, phone number and email to other nonprofit and commercial organizations. These could include companies with similar names to charities you support – but they exist solely to scam donations.
4. Computer scam
Someone calls pretending to be from a major company, such as Microsoft, and says he can see that your computer has a virus. He offers to help you get rid of it by asking you to log into a website that lets him control your computer – then steals your ID information.
5. Timeshare scam
If you own a timeshare, you may get a call from someone claiming they’re authorized to sell it for you, for a fee. After paying, however, you never hear from them again.
6. Homeowner scam
A man comes to your door and offers to clean your gutters or trim your trees, which sounds like a good idea. Until he asks for prepayment and never completes the job.
7. Medical scam
You get an unsolicited call about a discounted price for some kind of medical equipment (i.e., heart monitor, wheelchair or bathtub bench). He asks for a deposit and your personal information or Medicaid number to send the equipment, which never arrives.
8. Foreclosure scam
You’re approached by a “professional” who claims your home is under threat of foreclosure and offers to pay off your mortgage or taxes if you sign over the deed to the property. With your deed, the fraudster can then refinance the mortgage for the full value of your home and take the money. Keep in mind, even if you sign over a deed to someone, you are still liable for your mortgage obligations.
9. Caregiver and sweetheart scam
These predators claim to care deeply for you or your well-being, but after winning your trust, they gain access to your accounts to steal money or identity information.
10. Title company scam
Before purchasing or closing on a new property, a scammer intercepts an email from your realtor or title company. You’re then sent fraudulent payment instructions to complete the transaction. Red flags include last minute changes to instructions, a change in tone or word choice from prior emails, a new sender address and multiple payment requests.
These scams are common and widespread. But speaking with trusted loved ones or your financial professional before making decisions can help you avoid these traps. Additionally, keep in mind these tips for staying safe:
Don’t pay for things you don’t remember ordering.
Don’t give your personal information to unknown third parties.
Work with financial institutions that use fraud protection to safeguard your credit card and banking information.
Don’t click links in the body of suspicious emails, especially if they claim to come from your bank, credit card company, realtor or title company. Instead, log in to the company’s official website or call them directly to verify.
Don’t let strangers into your house. Instead, ask for a business card and say your spouse, kids or lawyer will be in touch.
Be wary of caregivers and suitors, especially if you notice signs of substance abuse or other red flags.
Limit the purchases and donations you make by check, which may list your home address or other key data.
Giving Thanks, Double Dip Unlikely
Monday Morning Outlook
Brian S. Wesbury, Chief Economist
Robert Stein, Deputy Chief Economist
Date: 11/16/2020
Give Thanks! The US economy continues to heal. Payrolls keep growing, unemployment claims - though still elevated - are shrinking, key measures of the manufacturing and service sectors remain well into positive territory, and, as this week should show, both retail sales and industrial production remain on an upward trajectory.
While some investors are concerned about the near-term outlook for the economy given the recent increase in cases of COVID-19, we have yet to see signs of a double-dip recession. Yes, some locations have begun imposing new limits on economic activity, and others may follow. But businesses have come a long way, learning how to adapt and move forward from the mid-March environment, back when dealing with COVID19 was brand new.
Think about businesses built around people commuting to work or leaving the office and going out to lunch; those operations have already shrunk substantially, putting another decline of that magnitude virtually out of the picture. Meanwhile, consumers have shifted their spending, generating jobs elsewhere. For example, home improvements are on track to hit a calendar-year record high in 2020. Housing starts will be the highest for any year since the crash in housing more than a decade ago. Warehousing & storage jobs are at a record high, as are courier & messenger jobs.
We don’t have the data yet, but migration between states and cities appears to have picked up substantially in 2020, as people leave areas that have experienced either excessive violence or draconian pandemic-related lockdowns. This is just another piece of evidence that businesses and individuals have found ways to continue being productive in the face of unprecedented events. For this, and other reasons, we don’t see a double-dip recession.
Imagine being told back at the beginning of 2020 that the world was about to be hit by a global pandemic that would lead to massive government-imposed shutdowns of business activity around the country. Imagine being told that we were going into a sudden (and sharp) recession which would see the largest single-quarter decline in economic activity since the Great Depression.
As an investor with that knowledge, what would you have done? Would you bail out of the stock market completely, or go all-in? We watched many run for cover as stocks fell sharply.
And yet, as of the close on Friday, the S&P 500 was up 11.0% year-to-date, and that doesn’t include reinvested dividends. The market is up for a number of reasons. 1) The S&P 500 includes many large tech companies that we could not have lived without, and many companies considered “essential.” 2) The Federal Reserve pushed the discount rate down significantly. 3) Government stimulus helped support consumer spending. 4) Companies adapted and lowered expenses, and 5) Many people accepted the risk of behaving somewhat normally as they looked at the data surrounding the virus.
The resilience of the economy and corporations has rarely been tested as it was this year. This experience, combined with recent announcements about vaccines and therapies, will lead to further economic growth. When a business had no idea how long it would be before a vaccine for COVID-19 was available, it made sense to postpone some investments indefinitely. But when the distribution of an effective vaccine looks like it’s around the corner, they can begin to take action on long-term plans even before the economy is fully healed. Much of the uncertainty – be it about vaccines, the Supreme Court, or the elections - has now more or less passed.
Some uncertainty remains, it’s never fully gone, but when we compare the unknowns of today to that of just seven months ago, the risk to remaining invested in great companies has substantially declined. Give thanks for progress. A double-dip, while always possible, is unlikely.
Date/Time (CST) U.S. Economic Data Consensus First Trust Actual Previous
11-16 / 7:30 am Empire State Mfg Survey – Nov 13.8 13.5 6.3 10.5
11-17 / 7:30 am Retail Sales – Oct +0.5% +0.3% +1.9%
7:30 am Retail Sales Ex-Auto - Oct +0.6% +0.3% +1.5%
7:30 am Import Prices – Oct 0.0% -0.2% +0.3%
7:30 am Export Prices - Oct +0.2% -0.1% +0.6%
8:15 am Industrial Production – Oct +1.0% +0.8% -0.6%
8:15 am Capacity Utilization – Oct 72.3% 72.0% 71.5%
11-18 / 7:30 am Housing Starts – Oct 1.460 Mil 1.471 Mil 1.415 Mil
11-19 / 7:30 am Initial Claims – Nov 14 700K 697K 709K
7:30 am Philly Fed Survey – Nov 22.0 31.0 32.3
9:00 am Existing Home Sales – Oct 6.450 6.680 Mil 6.540 Mil
The attached information was developed by First Trust, an independent third party. The opinions are of the listed authors at First Trust Advisors L.P, and are independent from and not necessarily those of RJFS or Raymond James. All investments are subject to risk. There is no guarantee that these statements, opinions, or forecasts provided in the attached article will prove to be correct. Individual investor's results will vary. Past performance does not guarantee future results. Forward looking data is subject to change at any time and there is no assurance that projections will be realized. Any information provided is for informational purposes only and does not constitute a recommendation. Investing involves risk and you may incur a profit or loss regardless of strategy selected. The S&P 500 is an unmanaged index of 500 widely held stocks that is generally considered representative of the U.S. stock market. Keep in mind that individuals cannot invest directly in any index, and index performance does not include transaction costs or other fees, which will affect actual investment performance.
No Wave is Good News For Stocks
Monday Morning Outlook
Brian S. Wesbury, Chief Economist
Robert Stein, Deputy Chief Economist
Date: 11/9/2020
While the election is still not certified, and court battles will drag on, it appears that we can draw two firm conclusions from the 2020 election. First, the pollsters were horribly wrong again. Secondly, American voters do not want a radical shift in economic policy.
While Vice President Biden declared victory based on statistical evidence compiled by the media, there remains some ambiguity. States have not yet formally certified their election results, President Trump is pushing back with court cases, and recounts will be automatic in some states because of the closeness of the results. That said, the odds favor a Joe Biden Presidency for the next four years.
But, for at least the next two years, he will be interacting with a Congress that looks much different from the Blue Wave that pollsters expected. We know it is 2020, and anything can happen, but after Alaska and North Carolina report, it appears that Republicans will have at least 50 seats in the US Senate. The outcome of two runoff elections in Georgia, taking place in early January, will determine the final Senate make-up and it appears Republicans will win at least one of those.
In addition, Democrats lost perhaps 10 seats in the House of Representatives and when all the counting is done, we expect the Democrats will have about 224 seats versus about 211 for Republicans. Because mid-term elections have historically favored the party out of power, this result is causing the moderate wing of the Democrat party to push back against their more progressive members.
This pushback has teeth because Republicans around the country, in both House and Senate races, generally won by greater margins or lost by narrower margins than President Trump in their districts and states. And Republicans increased their power at the state legislative level.
As far as policy goes, what all this means is that a major tax hike, the Green New Deal, Medicare for All, and court packing are off the table. Yes, a Biden Administration will generate more rules and regulations, but the federal courts and all those Trump appointees during the past four years are likely to make sure agencies and departments stick to their legal mandates as passed by Congress.
In terms of legislation, we do expect Congress to pass a stimulus bill in the lame duck session, but it will not be the $3 trillion that Speaker Pelosi and the Democrats were pursuing before the election. It will not bail-out the states, which is particularly painful for Illinois, but we still expect a $1 trillion package to help with distributing a vaccine and provide more money for unemployed workers.
Next year, investors should expect some sort of infrastructure spending package, passing with bipartisan support. Because President Biden will need to get some sort of tax victory, look for an increase in the itemized deduction for state and local taxes, to around $20,000 from the current level of $10,000. Normally the GOP would oppose this policy change – it’s a bigger tax cut for residents in high-tax states, who tend to vote for Democrats, than for people in low tax states, who tend to vote for Republicans – but it’s still a tax cut, not a hike.
Trade wars are off the table, however, it will be hard for a new White House to justify going soft on China or for reversing progress made toward peace in the Middle East.
Meanwhile, the economy continues to grow and corporate performance continues to improve. According to FactSet, 89% of all S&P 500 companies have reported earnings for the third quarter and 86% of them have reported earnings above expectations. This is happening for two reasons. First, revenues have been better than expected, and second, costs have been cut as companies have adapted to challenging times. Productivity is up 4.1% from a year ago.
With news of an effective vaccine, expectations that fiscal policies will not change in any major way, continued low interest rates, and the entrepreneurial power of the US economy, the stock market is well on its way to continue making new highs. As we have reminded investors over and over, personal political preferences can cloud judgement. This past week makes that point, powerfully.
Date/Time (CST) U.S. Economic Data Consensus First Trust Actual Previous
11-12 / 7:30 am Initial Claims – Nov 7 725K 731K 751K
7:30 am CPI – Oct +0.2% +0.2% +0.2%
7:30 am “Core” CPI – Oct +0.2% +0.2% +0.2%
11-13 / 7:30 am PPI – Oct +0.2% +0.2% +0.4%
7:30 am “Core” PPI – Oct +0.3% +0.2% +0.4%
9:00 am U. Mich Consumer Sentiment -Nov 82.0 82.3 81.8
The attached information was developed by First Trust, an independent third party. The opinions are of the listed authors at First Trust Advisors L.P, and are independent from and not necessarily those of RJFS or Raymond James. All investments are subject to risk. There is no guarantee that these statements, opinions, or forecasts provided in the attached article will prove to be correct. Individual investor's results will vary. Past performance does not guarantee future results. Forward looking data is subject to change at any time and there is no assurance that projections will be realized. Any information provided is for informational purposes only and does not constitute a recommendation. Investing involves risk and you may incur a profit or loss regardless of strategy selected.
Expect Volatility as We Await Presidential, Senate Outcomes

Economy and Policy
November 04, 2020
“We are in for a very uncertain several days and weeks ahead,” notes Raymond James Washington Policy Analyst Ed Mills.
President Trump has exceeded expectations and polling predictions, winning a number of the core states critical to his reelection. However, as of early Wednesday morning, former Vice President Biden was the only candidate to flip an Electoral College vote from 2016 by winning Arizona (the Trump campaign contests that Biden has won) and Nebraska’s 2nd Congressional district.
The winner of two of the following – Michigan, Pennsylvania and Wisconsin – likely wins the presidency. The count in these key final states could take several days, if not weeks, to decide, and the president declared he will take this to the Supreme Court.
Republicans appear to have the advantage in retaining their Senate majority, but that too could take days or weeks to finalize – possible even until the January Georgia runoff election. The House of Representatives, as expected, will retain a Democratic majority.
Expect a volatile period for the markets, especially as prospects for a near-term lame duck fiscal relief package will be diminished.
Contested election
The current election result is the scenario we believe has the greatest market risk, especially if the final count in multiple states could lead to a recount or court battle with the winner of the Electoral College at stake. President Trump has already vowed to seek Supreme Court intervention and has raised the concern of fraud. We are in for a very uncertain several days and weeks ahead.
For financial markets, a contested election would probably be a risk-off event. The only historical comparison is Bush/Gore in 2000, during which the equity market traded off ~5% and then recovered when the election was settled. We would expect a steeper selloff this time.
Trump outperforms
Once again, President Trump outperformed expectations and polling averages. President Trump’s strength came with increased turnout among his base, and he made significant inroads among Hispanic voters, especially in Florida. We had long viewed Trump’s electoral strategy as convincing supporters who did not vote in 2016 to vote in 2020. In a quick scan of the outcome, we would highlight that President Trump added more than 1,000,000 votes to his 2016 outcome – an impressive feat. The path forward for President Trump will require him to win two of the following three – Michigan, Pennsylvania and Wisconsin.
Biden confident
In a speech to supporters, Biden exuded confidence in his position in the race, especially in his position in Pennsylvania, but also highlighted the campaign’s standing in Michigan and Wisconsin. Biden stated that they are also closely watching Georgia, which has swung back and forth throughout the vote count. This clearly was not the blue wave that the campaign was hoping for, but they are attempting to establish an early impression of a lead.
Senate races
Toss-up races often break as a group toward one party or the other. Republicans had a much better election night than expected and are in a decent position to maintain their Senate majority. As expected, Arizona and Colorado flipped toward Democrats, Alabama flipped toward Republicans. The Georgia special election is headed toward a run-off on January 5, 2021.
House races
Democrats will retain their majority in the House of Representatives, but the final tally will take several days to finalize. While this will be welcomed news for Democrats, it was not the wide expansion of their majority that they had hoped for heading into the election.
Market implications: split government
This outcome would mean a slower recovery, the lowest chance for fiscal stimulus, no tax rate increase but likely any regulatory negatives. Probably positive on relative basis for defensive and interest-rate-sensitive sectors (staples, utilities, healthcare) and negative for recent “pro-cyclical” trade (industrials, materials, financials, small/mid-cap stocks).
Market implications: status quo
This outcome would be the most positive for stocks broadly and would likely mean more fiscal stimulus and a potentially lower income tax rate. Most positive for financials and energy due to the likelihood of less regulation. Technology would be more questionable given China relationship risk; large caps would likely outperform.
Market implications: Democratic sweep
This outcome would likely mean a steeper yield curve and higher taxes for smaller caps and cyclicals. Essentially, investors would likely move out of bonds and into equities, and small/mid caps are most positively correlated to higher rates and inflation expectations, therefore likely benefiting. This outcome would be most beneficial to those sectors most positively impacted by a steep yield curve or fiscal spending, such as industrials, materials and financials.
This information is being provided for information purposes only and is not a complete description, nor is it a recommendation. Expressions of opinion are as of this date and are subject to change without notice. Keep in mind that there is no assurance that any strategy will ultimately be successful or profitable nor protect against a loss. Investment products are: not deposits, not FDIC/NCUA insured, not insured by any government agency, not bank guaranteed, subject to risk and may lose value. ©2020 Raymond James & Associates, Inc., member New York Stock Exchange/SIPC. ©2020 Raymond James Financial Services, Inc., member FINRA/SIPC.
No More Lockdowns
Monday Morning Outlook
Brian S. Wesbury, Chief Economist
Robert Stein, Deputy Chief Economist
Date: 11/2/2020
As the US opened up, real GDP rebounded sharply in the third quarter, growing at a 33.1% annual rate. However, real GDP is still down 2.9% from a year ago and the economy got a huge boost from spending by the federal government, which borrowed from the future in order to allow people to spend today.
The federal government spent $6.55 trillion in the Fiscal Year ending September 30, 2020, up 47.3% from FY2019. In total, the federal government spent 31.2% of GDP, the highest share since 1945. In the final year of World War II, national defense spending was 36.6% of GDP, while all other spending combined was only 4.4%. This past year, military spending was 3.5% of GDP, all other spending combined was 27.7%.
Some of this money was spent directly “fighting” the virus – ventilators, PPE, field hospitals, payments to hospitals for COVID-19 patients – but most was used to support small business and workers during the pandemic. To put this in perspective, non-defense spending in 2020, as a share of GDP was 40% larger than its previous peak of 19.8% of GDP back in 2009.
This can’t continue. Although the current debt of the US government is manageable, and would be even more so if we locked in low interest rates by issuing longer-term debt securities, that doesn’t mean we can indefinitely run annual budget deficits of more than $3 trillion, like we did last year.
Super-high spending during World War II was a price America decided to pay in order to preserve civilization and the American way of life. Now we’re spending massive amounts so we can keep businesses shut to try to fight a virus.
Certainly, some measures need to be taken to secure the most vulnerable, like the elderly, or people with underlying health problems. But we also need to come to grips with the fact that shutdowns cause long-term harm. We all know the physical and mental health problems that business and school closures have on people. These are real. What is talked about less is the fact that the kind of government spending we are seeing can have long-term consequences for the economy and our ability to deal with future problems. This is compounded by the fact that our government wants another $1 - 3 trillion in spending to address continuing economic problems.
A vaccine may come along that helps us deal with COVID-19 (and we hope it does), but that vaccine will only help with “one” virus, not all of them. At least by winning WWII we stopped anyone from trying to take over the world.
If another virus comes along, will we do the same thing – shutdown the economy, print money and spend – again?
We certainly hope not. The debt and money printing the US has done can only be absorbed by economic growth in the years to come. After WWII, the US economy expanded rapidly, partly because it was less damaged by war, which allowed us to reduce the debt burden as a share of GDP. This time is different. We can’t lockdown again.
Date/Time (CST) U.S. Economic Data Consensus First Trust Actual Previous
11-2 / 9:00 am ISM Index – Oct 55.8 56.2 59.3 55.4
9:00 am Construction Spending – Sep +1.0% +0.7% +0.3% +1.4%
11-3 / 9:00 am Factory Orders – Sep +1.0% +0.5% +0.7%
afternoon Total Car/Truck Sales – Oct 16.5 Mil 16.0 Mil 16.3 Mil
afternoon Domestic Car/Truck Sales – Oct 12.5 Mil 12.5 Mil 12.8 Mil
11-4 / 7:30 am Int’l Trade Balance – Sep -$63.9 Bil -$63.9 Bil -$67.1 Bil
9:00 am ISM Non Mfg Index – Oct 57.5 57.6 57.8
11-5 / 7:30 am Initial Claims - Oct 31 735K 730K 751K
7:30 am Q3 Non-Farm Productivity +5.0% +7.6% +10.1%
7:30 am Q3 Unit Labor Costs -10.0% -13.6% +9.0%
11-6 / 7:30 am Non-Farm Payrolls – Oct 600K 600K 661K
7:30 am Private Payrolls – Oct 700K 700K 877K
7:30 am Manufacturing Payrolls – Oct 53K 35K 66K
7:30 am Unemployment Rate – Oct 7.7% 7.6% 7.9%
7:30 am Average Hourly Earnings – Oct +0.2% +0.2% +0.1%
7:30 am Average Weekly Hours – Oct 34.7 34.6 34.7
2:00 pm Consumer Credit– Oct $8.3 Bil $5.0 Bil -$7.2 Bil
The attached information was developed by First Trust, an independent third party. The opinions are of the listed authors at First Trust Advisors L.P, and are independent from and not necessarily those of RJFS or Raymond James. All investments are subject to risk. There is no guarantee that these statements, opinions, or forecasts provided in the attached article will prove to be correct. Individual investor's results will vary. Past performance does not guarantee future results. Forward looking data is subject to change at any time and there is no assurance that projections will be realized. Any information provided is for informational purposes only and does not constitute a recommendation. Investing involves risk and you may incur a profit or loss regardless of strategy selected.
Rough Day for Stocks as COVID-19 Cases Surge, Election Looms

Markets and Investing
October 26, 2020
The S&P 500 posted its worst daily decline since late September but didn’t entirely erode October gains.
Stocks faltered at the beginning of the week as COVID-19 cases surged and stimulus talks stalled. Uncertainty surrounding the 2020 election also drove market declines.
The S&P 500 (-1.9%), Dow Jones Industrial Average (-2.3%) and NASDAQ (-1.6%) each sharply declined today. More specifically, the S&P 500 closed below its 50-day moving average for the first time in three weeks. While moves like this are uncomfortable and never easy to digest, it is important to put the decline in perspective, cautioned Chief Investment Officer Larry Adam. For the S&P 500, it was the worst daily decline since September 23 (basically one month ago). Even with the decline, the broad-market domestic index remains up ~1% for the month of October. This week, the market will receive economic data points that show the strongest quarter of economic growth in history (estimated at 25% to 30%) and the busiest week in earnings reports should highlight the resiliency of corporate America overall as earnings continue to improve and come in well above estimates.
A third wave of coronavirus cases in the U.S. spiked to 83,000, the highest ever single-day count, on October 23, coming close to that mark again the very next day, explained Healthcare Policy Analyst Chris Meekins. The average daily cases, week over week, continue to climb, as do hospitalizations and, sadly, fatalities, although the rate itself is lower than at the beginning of the pandemic.
“It is crucial for Americans to maintain vigilant mitigation measures; the virus’s spread is heading in an extremely concerning direction that could prove catastrophic for our country’s healthcare system and economy,” Meekins said. White House Chief of Staff Mark Meadows announced on Sunday that we will not be able to control the pandemic and should instead focus on vaccines and therapeutics.
Although unemployment rates remain high, consumers seem to have adjusted, returning to more familiar spending patterns as we await news of further fiscal stimulus. Talks have been in the works for some time. While there’s still hope that a bipartisan deal can be reached, policy differences remain the largest hurdle. Washington insiders seem to anticipate a post-election package in line with the government funding deadline on Dec. 11 or the year-end expiration of the Federal Pandemic Unemployment Compensation program, explained Ed Mills, Washington policy analyst.
Large swaths of the country have been contending with natural disasters, from multiple hurricanes to widespread wildfires. All of this, in addition to the upcoming Election Day, creates headwinds for the economy and the domestic equity markets in what has proven to be an already volatile year. More volatility is expected in the days to come, no matter which party takes control of Congress and the White House. If you’re concerned that the markets will dive or thrive based solely on who is in the Oval Office, historic trends show that anxiety has been unfounded in the past. Future growth is anticipated no matter what happens in D.C., but it may take some time.
Past performance may not be indicative of future results. Investing involves risk, and investors may incur a profit or a loss. All expressions of opinion reflect the judgment of the Raymond James Chief Investment Office and are subject to change. Economic and market conditions are subject to change. The S&P 500 is an unmanaged index of 500 widely held stocks. The Dow Jones Industrial Average is an unmanaged index of 30 widely held stocks. The NASDAQ Composite Index is an unmanaged index of all common stocks listed on the NASDAQ National Stock Market. The performance mentioned does not include fees which would reduce an investor’s performance. An investment cannot be made in these indexes.
Economy Poised for More Growth
Monday Morning Outlook
Brian S. Wesbury, Chief Economist
Robert Stein, Deputy Chief Economist
Date: 10/26/2020
To reiterate, this Thursday morning we expect the government to report a huge, and virtually unprecedented, surge of a 33.4% annualized growth rate in real GDP growth for the third quarter. There are still a few monthly reports due this week that could affect our forecast, but only slightly.
Obviously, the US will not keep growing at this rate, but the question remains about how much might it slow? Believe it or not, because we have September data – the "jumping off point" for the fourth quarter – we can start to make some early estimates about reported future growth rates. Right now, an annualized growth rate of 5% is highly possible and it could be even higher.
All of this depends on COVID-related shutdowns. As the US conducts more that 1 million tests per day, and uses highly sensitive tests as well, there has been a new "surge" in COVID-19 cases. In spite of this surge in new cases, deaths have remained relatively stable. This means the "case fatality rate" is falling. Nonetheless, because of fear about the surge in new cases, some politicians, like Illinois Governor Pritzker, have shutdown activities like indoor dining. So far, these new shutdowns are not widespread enough to alter the course of the macro-economy in any significant way, but that could obviously change.
If it doesn't, and US economy holds its September activity level, the fourth quarter is looking strong. Take cars and light trucks, for example, which sold at a 16.34 million annual rate in September versus the third quarter (July, August and September) average of 15.38 million. In other words, auto sales were an annualized 27.3% higher in September that the third quarter average. So, if vehicle sales flatline in the fourth quarter (October, November and December), they would be 27.3% higher, at annual rate, versus the third quarter average. The same goes for retail sales outside the auto sector: even if they remain unchanged in October, November, and December, the September level was already 4.7% annualized above the average level for Q3.
Single-family home building shows a similar pattern. Without any change in single-family housing starts for the last three months of the year, the quarterly average would still show growth at a 28.8% annual rate versus the Q3 average. Note that this is not true for multi-family housing starts, but those starts are so volatile from month to month that the jumping off point in September is less meaningful.
Rest assured we are not just cherry-picking the very best data. The total number of hours worked in the private sector were up at a 3.9% annual rate in September versus the Q3 average. Manufacturing output was up at a 0.8% annual rate in September versus the Q3 average. Both the ISM Manufacturing and ISM Service indexes finished September higher than the average for the third quarter. So, while some data reflect very strong growth and other data reflect more moderate growth, the general direction of the economy remains positive.
Given that we are nearing a presidential election, there are many unknowns regarding public policy for the next several months. Future tax rates on regular income, capital gains, and dividends, spending, tariffs, regulations,...all up for grabs. Who knows, maybe even the addition of states, additional limits on the Senate filibuster, and Court packing, as well.
That's why it's important to take stock of where we are right now. A full recovery from the disaster earlier this year is a long way off, but we believe that recovery started several months ago, and the early read is that the fourth quarter should be solid, as well.
The attached information was developed by First Trust, an independent third party. The opinions are of the listed authors at First Trust Advisors L.P, and are independent from and not necessarily those of RJFS or Raymond James. All investments are subject to risk. There is no guarantee that these statements, opinions, or forecasts provided in the attached article will prove to be correct. Individual investor's results will vary. Past performance does not guarantee future results. Forward looking data is subject to change at any time and there is no assurance that projections will be realized. Any information provided is for informational purposes only and does not constitute a recommendation. Investing involves risk and you may incur a profit or loss regardless of strategy selected.
Answering Four Common Questions About COVID-19 and 529 Plans

Family and Life Events
September 29, 2020
Learn how virtual classes, gap years, K-12 expenses and refunds may impact your education savings.
The COVID-19 outbreak has upended normal life across the world, and higher education has been no exception. As more college students respond to the pandemic by taking a gap year (i.e., a year-long break from school) or opting for reduced course loads, you may be wondering what these and other changes could mean for your 529 plan. Fortunately, we’ve got answers.
My college student is enrolled in virtual classes this semester. What expenses are covered under my 529 plan?
Higher education expenses that would normally be covered under a 529 plan also apply to virtual classes. These expenses include tuition, books, school supplies, fees, computer equipment and peripherals. Room and board will also be covered if your student is enrolled at least half time. To explore estimated expenses for an academic year, visit the respective college or university’s cost of attendance page.
If my college student takes a gap year or enrolls in fewer classes this semester, how would it affect my education savings?
Since 529 plans do not have an expiration date, your funds will be ready when you need them. This means you can resume distributions as you normally would once your student returns to school. If your student has opted for a reduced course load, then tuition, supplies and fees will all be covered by your 529 plan. However, they will need to be enrolled at least half time for room and board to qualify under your plan. If you have any questions regarding your student’s level of enrollment (partial, half time or full time), contact their educational institution.
I have a K-12 student. Can I use my 529 plan to purchase a computer? What about tutoring services?
The K-12 provision in 529 plans applies exclusively to tuition expenses. You may use up to $10,000 each year to cover these costs. While K-12 distributions are considered a qualified expense under federal law, not every state treats K-12 distributions in the same manner. To determine how your state treats K-12 distributions, consult with a local tax professional.
I received a refund from my student’s school. What are my options?
You have several options when it comes to managing amounts refunded by the school. The first is to use the refunded amount toward other qualified education expenses that same calendar year. This will ensure that your 1099 matches the incurred expenses. The second option is to re-contribute the refunded amounts back into the 529 plan within 60 days of the day the school issued the check. This contribution will be counted as a current year contribution. Just remember to safely store documentation of the refund and re-contribution for your records.
Earnings in 529 plans are not subject to federal tax and in most cases state tax, as long as you use withdrawals for eligible education expenses. However, if you withdraw money from a 529 plan and do not use it on an eligible education expense, you generally will be subject to income tax and an additional 10% federal tax penalty on earnings. Investment products are: not deposits, not FDIC/NCUA insured, not insured by any government agency, not bank guaranteed, subject to risk and may lose value.
Your Year-End Tax Planning Checklist

Tax Planning
September 28, 2020
Kickstart your tax season planning with this list of important deadlines, relevant documents and strategy considerations.
With the end of the year fast approaching, now’s the time to take advantage of tax-deferred growth opportunities, tax-advantaged investments and charitable giving opportunities, among other strategies. You’ll also want to maximize deductions and credits ahead of tax season.
As you consider these year-end options, sit down with your advisor to review your investments in light of your goals, the tax environment and the economic landscape. The conversation can help identify where adjustments need to be made to position yourself for next year and beyond.
Use the year-end tax planning worksheet below to kickstart the conversation and keep you on track throughout the upcoming tax season.
Year-End Tax Planning Worksheet
Raymond James financial advisors do not render advice on tax or legal matters. You should discuss any tax or legal matters with the appropriate professional.
Covid-19 360 Game Changers
Coronavirus Webinar Presentation
Larry Adam, CFA, CIMA®, CFP®
Chief Investment Officer
September 14, 2020
Webinar Replay: Chief Investment Officer Larry Adam discusses the latest in vaccines and therapeutics, potential virus hot spots and school reopening.
Click the link to view presentation: https://www.raymondjames.com/investment-strategy-client-call
The views expressed in this commentary are the current opinion of the Chief Investment Office, but not necessarily those of Raymond James & Associates, and are subject to change. Information contained in this report was received from sources believed to be reliable, but accuracy is not guaranteed. Past performance is not indicative of future results. No investment strategy can guarantee success. There is no assurance any of the trends mentioned will continue or that any of the forecasts mentioned will occur. Economic and market conditions are subject to change. Investing involves risks including the possible loss of capital. Material is provided for informational purposes only and does not constitute a recommendation. Asset allocation does not ensure a profit or protect against a loss. Diversification and asset allocation do not ensure a profit or protect against a loss. Dollar cost averaging cannot guarantee a profit or protect against a loss, and you should consider your financial ability to continue purchases through periods of low price levels.
Equities Pull Back From Early September Highs
Markets and Investing
September 21, 2020
The Dow Jones Industrial dipped almost 3% on Monday, and the S&P 500 slid more than 2% from the previous week, off about 7% from its recent highs earlier this month.
Investors have had a lot to process over the past few days. Domestic equity declines, on top of global ones, dovetailed with the loss of legendary Supreme Court Associate Justice Ruth Bader Ginsburg, as well as a rise in COVID-19 cases across the nation. The Dow Jones Industrial dipped almost 3% on Monday, and the S&P 500 slid more than 2% from the previous week, off about 7% from its recent highs earlier this month. Large-cap tech names, which had experienced a run up in recent months, began to drag on the broader markets this week, while the rest of the stocks generally held their ground.
September has historically been a weak month for equities. Chief Investment Officer Larry Adam has repeatedly cautioned that this seasonal slump combined with expected election volatility and valuations at their highest level in almost two decades could make the equity markets vulnerable to the modest pullback we’re seeing now.
Progress on the pandemic has been a mixed bag of late, one step forward, two steps back. The daily average number of cases jumped 17% within a week, according to Healthcare Analyst Chris Meekins, although the seven-day average continues to hover around 5%. Labor Day gatherings, schools reopening and relaxed mitigation measures likely all contribute to the uptick, he believes.
The passing of Justice Ginsburg leaves an opening on the Supreme Court late in an already-contentious presidential election cycle – potentially ushering in a partisan political battle, as well as a shift in the electoral landscape, according to Ed Mills, Washington policy analyst.
The latest economic reports also reflect a more moderate recovery, following sharp-but-partial improvement over the summer, explains Chief Economist Scott Brown. The Federal Reserve continues to do its part to provide liquidity to the financial system, but another round of government assistance might be hindered by political division ahead of the election with a Supreme Court vacancy in the balance.
We continue to view unprecedented global stimulus and record low interest rates as supportive of equities over the intermediate term, adds Senior Portfolio Analyst Joey Madere, who sees short-term volatility as potential opportunity to selectively add to a portfolio.
Your financial advisor can help address any questions you may have about recent volatility and its effect on your financial plan.
Investing involves risk, and investors may incur a profit or a loss. All expressions of opinion reflect the judgment of Raymond James and are subject to change. There is no assurance that any of the forecasts mentioned will occur. Past performance is not indicative of future results. Economic and market conditions are subject to change. The Dow Jones Industrial Average (DJIA), commonly known as “The Dow”, is an index representing 30 stocks of companies maintained and reviewed by the editors of the Wall Street Journal. The S&P 500 is an unmanaged index of 500 widely held stocks that is generally considered representative of the U.S. stock market. It is not possible to directly invest in an index.
Thoughts On The Market
Putting Market Activity Into Perspective
Larry Adam, CFA, CIMA®, CFP®, Chief Investment Officer
September 8, 2020
With the ‘unofficial’ end of summer marked by the Labor Day weekend, the S&P 500 and NASDAQ have disappointingly fallen 7% and 10%, respectively, over the last three days. Throughout this recent pullback, it has been the sectors with the strongest year-to-date returns that have led the decline. Pullbacks within the equity market are always unsettling, so below are ten points to put the recent decline into perspective and, hopefully, reduce investors’ elevated levels of anxiety.
1. First Three Consecutive Daily Declines in Three Months It is unusual for the equity market to move up in an uninterrupted, straight line. In fact, this recent three-day pullback marked the first three consecutive day decline since June 11 and only the second since March 10. Over the last ten years, it is common to see the equity market exhibit short bouts of volatility like this. In fact, on average, the S&P 500 typically has ~10 individual periods of three consecutive days of declines over a six-month time period (that is almost twice a month). Volatility is part of the fabric of the market.
2. Back to Levels of One Month Ago Despite the S&P 500’s 7% decline over the past three days, it sits at the levels we saw just one month ago! Additionally, the S&P 500 and NASDAQ are up 3% and 21%, respectively, year-to-date. Both were at record highs just one week ago.
3. Still the Second Strongest Bull Market at this Juncture Even with the recent weakness, the S&P 500 remains up ~50% off of the lows on March 23. This marks the second strongest start to a bull market at this juncture
4. Best Summer Since 2009 Even with the recent pullback, the S&P 500 posted the best summer return (up 16% from Memorial Day to Labor Day) since 2009 and the second best over the last 50 years. This reflects how strong the recent momentum in the market has been despite continued COVID and political uncertainties.
5. September Is the Weakest Month On an historical basis, September (particularly during an election year) has been the weakest month of the year, on average. While volatility tends to increase during September and October, the market pullbacks, on average, tend to be relatively contained and offset by a rally in November and December.
6. Pullbacks Are Normal Not only have we rallied strongly and very quickly, it is not uncommon to see pullbacks in a given year. In fact, over the last 30 years, the market typically experiences approximately four 5% or more pullbacks a year, on average. Year-to-date, this is the third.
7. Improving Economy Evidenced by both the improving labor market report (1.4 million jobs added and unemployment rate falling to 8.4%), and a strong ISM reading (the new orders subcomponent rose to the highest level since 2004) last week, the US economy continues to recover from the COVID-driven weakness. We forecast 3Q US GDP to rebound and grow ~30% and improving economic activity should remain supportive for the US equity market.
8. Continue to Believe in a Phase 4 Package As both political parties continue to jockey around a Phase 4 stimulus package, our Washington Policy Analyst, Ed Mills, believes that there will be an agreement. Further fiscal stimulus (particularly targeting the consumer) should be supportive of both consumer spending and the equity market.
9. Improving Earnings While earnings expectations had been slashed following the COVID-driven crisis, earnings throughout the second quarter came in significantly better than expectations. Going forward, we expect earnings to continue to improve as fullyear 2020 and 2021 Earnings Per Share (EPS) expectations continue to move higher. Our S&P 500 2021 earnings forecast is ~$160, with room for upside.
10. US Equities Remain Technically Sound Despite the recent pullback, US equities remain above both their 50-day (3,305) and 200-day (3,094) moving averages. Technicians will look for these to remain levels of support. Staying above these moving averages will continue to portray a technically sound equity market. From a sentiment perspective, there were several technical indicators that suggested the equity market was ‘overbought’ and in need of a consolidation period. For example, given the rally before the recent pullback, put/call ratios moved to multiyear lows (showing investors becoming complacent) and the 14-day Relative Strength Index (RSI) rose to the highest level in 2.5 years and moved into the 99th percentile over the last 30 years.
Bottom Line: Given how far and fast the equity market had rallied, it is not surprising to experience a period of consolidation and digestion. Given that valuations on both a trailing and forward basis remain near multi-year highs, the market was priced to perfection and susceptible to disappointments. Near term, equities are likely to remain volatile with the potential for further weakness due to the uncertain timing for a potential COVID vaccine, fiscal relief deliberations, the upcoming presidential election and burgeoning tensions with China. However, the trajectory for US equities is higher over the next 12 months (12-month target 3,600) as a result of improving global economic activity, recovering earnings and still supportive fiscal and monetary policy. As a result, we believe that long-term investors should continue to use periods of weakness as buying opportunities to add to our favorite sectors (Information Technology, Communication Services, Health Care and Consumer Discretionary).
To view whole article click the link below:
S&P 500 Climbs Over 7% in August, Attains New All-Time High

Markets and Investing
August 31, 2020
Led by technology and large-cap companies, the S&P 500 is on pace to post its best summer performance in over 80 years.
The S&P 500 hit a new high on August 18 for the first time since February, making up for the losses in March, and continued to climb through the month. Technology and large-cap companies led the way, continuing the “tale of two markets” hidden inside the mainstream indices, a familiar story throughout the COVID-19 era.
“August has historically been relatively weak for the broad-market S&P 500, but that didn’t stop the equity index climbing over 7% for the month as the S&P 500 is on pace to post its best summer performance (+18% post-Memorial Day) since 1938,” said Chief Investment Officer Larry Adam, “despite headwinds from COVID-19, a heated election and a Congressional stalemate over a new round of stimulus.”
The markets may have been buoyed by a stronger-than-expected earnings season, progress on COVID-19 therapeutics and vaccines, improving economic data and continued stimulus from the Federal Reserve.
There is also evidence of strength underneath the top performers, with gains being made in a fairly broad swath of the market, with second quarter corporate earnings finishing 23% above estimates, led by the performance of Consumer Discretionary stocks, Industrials, Health Care and Materials. “From the economic recovery to a possible vaccine, more records may occur by year-end. This year has proven to be tumultuous for the markets, but above all, we encourage investors to keep their long-term objectives and asset allocation in mind,” Adam said.
The strength of the market since the struggles of March doesn’t tell the full story. There are still concerns about coronavirus transmission in newly reopened schools, and market observers continue to keep an eye on unemployment figures and household earnings.
“The economic outlook continues to depend on the virus, the efforts to contain it and the degree of government support. Recent reports have painted a mixed picture of the economy,” said Chief Economist Scott Brown.
While Congressional lawmakers are not working against a specific deadline to pass a new round of economic stimulus, “we are watching a Sept. 30 government funding deadline as the next potential target for a legislative package, which could be tied to a must-pass bill in order to avoid a government shutdown,” said Washington Policy Analyst Ed Mills.
Monetary policy will remain accommodative. Federal Reserve Chairman Jerome Powell announced that the central bank has adopted a more tolerant approach to inflation. The Federal Reserve, recognizing that low unemployment significantly benefits low- and medium-income households, also made its employment objective “a broad-based and inclusive goal.” As a consequence, short-term interest rates are expected to remain lower for longer.
The change is subtle, however, and not a big shift from how the Federal Reserve has conducted policy in recent years.
With everything going on we are likely to see more records being set in the days to come, but in the meantime, the major indices showed strong performance through the month, including the S&P 500’s 7.01% gain and the NASDAQ continuing to lead with 9.59% added.
7.01% gain and the NASDAQ continuing to lead with 9.59% added.
12/31/19 Close 8/31/20 Close Change Year to Date % Gain/Loss Year to Date
DJIA 28,538.44 28,430.05 -108.39 -0.38%
NASDAQ 8,972.61 11,775.46 +2802.85 +31.24%
S&P 500 3,230.78 3,500.31 +269.53 +8.34%
MSCI EAFE 2,036.96 1,910.82 -126.14 -6.19%
Russell 2000 1,668.47 1,561.88 -106.59 -6.39%
Bloomberg Barclays 2,225.00 2,371.84 +146.84 +6.60%
Aggregate Bond
Performance reflects price returns as of market close on Aug. 31, 2020, except for the MSCI EAFE and Bloomberg Barclays Aggregate Bond, which reflect the Aug. 28 closing values.
Analysts are looking at these key factors, both here and abroad.
Economy
“Consumer spending rebounded sharply in May and June, from a steep decline in March and April, but the pace of improvement appears to have moderated,” Brown said.
The housing market is strong, aided by low mortgage rates and an expected longer-term shift in working from home. Sales of big-ticket items like cars and boats have benefited from recovery rebate checks and limited spending options available elsewhere, such as restaurants, tourism and live events.
Service sector job losses have been concentrated in the lower end of the income scale. About half of these jobs have come back, but weekly unemployment claims remain historically high. “To maintain earnings, firms may resort to further job cuts in the months ahead, which would dampen the pace of the recovery,” Brown said. “State and local governments are experiencing significant budget strains, which will likely also lead to job cuts.”
Equities
“COVID-19’s massive fundamental impact is set to wane and provide easy comparisons in 2021, which should support broad-based sector improvement,” said Joey Madere, senior portfolio strategist, Equity Portfolio & Technical Strategy.
The S&P 500’s price-to-earnings ratio is historically high, but not excessively so, Madere said. “We believe valuation can stay elevated given the unprecedented amount of global stimulus supporting the economic recovery, along with low interest rates and inflation.”
International
Despite poor second-quarter economic statistics, most international markets made some positive progress, European Strategist Chris Bailey said. Although, we still await conclusive news about ongoing discussions between the U.S. and China, and the U.K.’s attempts to forge a detailed Brexit deal in Europe.
A number of major emerging markets outside of China continue to see a high number of new cases. However, northeast Asia and Europe have only seen localized second pandemic waves to date, although numerous travel restrictions and government economic support schemes remain in place.
“August is always an unusual month for global investors. As the month progresses, not only does the global corporate earnings season start to peter out, but financial market liquidity also begins to drop. And while this has led to extreme financial market volatility in previous years, August 2020 will not particularly trouble the history books,” Bailey noted.
Fixed income
“The bond market had a pretty active August,” Chief Fixed Income Strategist Kevin Giddis tells us. “The 10-year yield fell to a new record close, as fear of a longer, lower recovery created a new ‘wall of worry’ for bondholders. But just as quickly as the yield fell, it rebounded upward six days later. As long as the Fed remains this accommodative and the U.S. economy struggles to find its ‘footing,’ Treasury rates continue to be range bound.”
Treasury notes and bonds continue to get a lot of attention from foreign central banks, domestic banks with low loan demand, and the Federal Reserve. Even though rates are near record lows, investors of other sovereign debt still see a positive sloping Treasury yield curve as an attractive alternative to many countries’ negative yields.
Taxable municipal bonds are likely a better long-term credit risk than similar corporate bonds, Giddis said.
Bottom line
A remarkable run has erased much of the losses shown by the mainstream indices, with the S&P 500 surpassing its previous February high in August and continuing to rise. While technology companies’ strength has been incredible – Apple is now valued at over $2 trillion, for example – the broad gains made elsewhere are worth considering.
In the coming months, don’t be surprised to see an increase in volatility leading up to the U.S. election, said Madere. “While emotions may run high, we would use weakness as a buying opportunity. While the market recovery has been remarkable, we remain positive for the long-term, bull-market opportunity that remains.”
Your advisor will continue to share any new developments that affect your financial plan. In the meantime, please reach out to him or her if you have any questions.
Investing involves risk, and investors may incur a profit or a loss. All expressions of opinion reflect the judgment of Raymond James and are subject to change. There is no assurance the trends mentioned will continue or that the forecasts discussed will be realized. Past performance may not be indicative of future results. Economic and market conditions are subject to change. The Dow Jones Industrial Average is an unmanaged index of 30 widely held stocks. The NASDAQ Composite Index is an unmanaged index of all common stocks listed on the NASDAQ National Stock Market. The S&P 500 is an unmanaged index of 500 widely held stocks. The MSCI EAFE (Europe, Australia, Far East) index is an unmanaged index that is generally considered representative of the international stock market. The Russell 2000 is an unmanaged index of small cap securities. The Bloomberg Barclays US Aggregate Bond Index is a broad-based flagship benchmark that measures the investment grade, U.S. dollar-denominated, fixed-rate taxable bond market. An investment cannot be made in these indexes. International investing involves additional risks such as currency fluctuations, differing financial accounting standards, and possible political and economic instability. These risks are greater in emerging markets. Bond prices and yields are subject to change based upon market conditions and availability. If bonds are sold prior to maturity, you may receive more or less than your initial investment. There is an inverse relationship between interest rate movements and fixed income prices. Generally, when interest rates rise, fixed income prices fall and when interest rates fall, fixed income prices rise. Investments in municipal securities may not be appropriate for all investors, particularly those who do not stand to benefit from the tax status of the investment. Municipal bond interest is not subject to federal income tax but may be subject to AMT, state or local taxes.
The Housing Revival
Monday Morning Outlook
Brian S. Wesbury - Chief Economist
Robert Stein, CFA - Dep. Chief Economist
August 24th, 2020
The US economy got crushed in the second quarter, with the worst decline in real GDP for any quarter since the Great Depression. However, the long road to recovery has started and, for now, we’re penciling in real GDP growth at a 20% annual rate for the third quarter. Of all the parts of the US economy that have weathered the COVID-19 storm, none has been as resilient as the housing market.
Homebuilders started homes at a nearly 1.6 million annual rate in December, January, and February, before the Coronavirus and government-mandated shutdowns wreaked havoc. Those were the best three months since 2006 and showed that residential construction had finally fully recovered from the housing implosion that was a center point of the last recession.
Then, during the shutdowns, homebuilding plummeted: housing starts bottomed at a 934,000 annual pace in April, before gaining in May, June and July, hitting an almost 1.5 million pace last month.
We have been saying for the past several years that the fundamentals of the housing market suggest an underlying norm of 1.5 million housing starts per year. This is based on a combination of population growth (more people mean more housing) and scrappage (homes don’t last forever, either because of voluntary knockdowns, fires, floods, hurricanes. tornadoes,…etc.).
However, in the ten years ending in February (March 2010 through February 2020) builders had only started 1.011 million units per year. Part of this made sense: home builders started too many homes during the housing bubble and the only way to work off that excess inventory was to build fewer homes than normal. But, in our view, the inventory correction went too far. In the 20 years through February (March 2000 through February 2020), housing starts only averaged 1.265 million. Too low.
All of this suggests to us that home builders still need to make up for lost time, until the long-term average is closer to 1.5 million per year, which could mean reaching, and then averaging, a pace of something like 1.8 million starts for the next several years.
But it’s not only home building that’s recovered so quickly; home sales have revived, as well. Existing homes were sold at a 5.76 million annual place in February, the fastest pace since the housing bubble burst. Then sales plummeted in March, April, and May, bottoming at an annualized pace of 3.91 million, the slowest since 2010. Since May, however, sales have soared, hitting a 5.86 million annualized pace in July, even beating where we were in February.
Part of the recent gain was likely pent-up home purchases: people who wanted to buy earlier in the year but got temporarily thrown off track by the Coronavirus, massive economic contraction, as well as general uncertainty. But including the drop and the rebound, the average pace of sales in the last five months (March through July) is still slow, suggesting some further gains ahead. Ditto for new home sales, although neither existing nor new home sales will grow every month.
In terms of prices, we expect national average home prices to continue to grow, but with a wide dispersion. Dense cities hit hard by COVID-19, or which have seen social unrest (or both!), especially with the newfound ability to work remotely, are going to be relative losers; other metro areas are going to experience faster gains.
Yes, a Biden win in November could end up expanding the state and local tax deduction, helping some beleaguered cities. But that election outcome is not assured. The enlarged standard deduction would still mean fewer people itemize, and the Biden campaign wants to limit the “value” of itemized deductions to 28% (instead of a proposed top tax rate of 39.6%). Bottom line: housing is going to be a significant tailwind for the US economy overall, but not everywhere.
Date/Time (CST) U.S. Economic Data Consensus First Trust Actual Previous
8-25 / 9:00 am New Home Sales – Jul 0.785 Mil 0.772 Mil 0.776 Mil
8-26 / 7:30 am Durable Goods – Jul +4.5% +5.0% +7.6%
7:30 am Durable Goods (Ex-Trans) – Jul +1.8% +1.3% +3.6%
8-27 / 7:30 am Initial Claims – Aug 22 1.000 Mil 1.040 Mil 1.106 Mil
7:30 am Q2 GDP Preliminary Report -32.5% -32.4% -32.9%
7:30 am Q2 GDP Chain Price Index -1.8% -1.8% -1.8%
8-28 / 7:30 am Personal Income – Jul -0.4% -0.5% -1.1%
7:30 am Personal Spending – Jul +1.5% +1.5% +5.6%
8:45 am Chicago PMI 52.5 51.2 51.9
9:00 am U. Mich Consumer Sentiment- Aug 72.8 73.0 72.8
The attached information was developed by First Trust, an independent third party. The opinions are of the listed authors at First Trust Advisors L.P, and are independent from and not necessarily those of RJFS or Raymond James. All investments are subject to risk. There is no guarantee that these statements, opinions, or forecasts provided in the attached article will prove to be correct. Individual investor's results will vary. Past performance does not guarantee future results. Forward looking data is subject to change at any time and there is no assurance that projections will be realized. Any information provided is for informational purposes only and does not constitute a recommendation. Investing involves risk and you may incur a profit or loss regardless of strategy selected.
3 Myths About Voting and Market Volatility

Economy and Policy
August 19, 2020
When it comes to investors' decisions about the market, the election is just one factor among many.
Every four years, the U.S. presidential election brings uncertainty – something the human mind, and markets, tends to dislike. But if you’re concerned that the markets will dive or thrive based solely on who is in the oval office, historic trends show that anxiety is unfounded. Through the last century, the long-term performance of the markets has revealed little correlation with government policies, according to an analysis by Raymond James Equity Research.
Here, we address three myths surrounding elections and market performance.
Myth #1: The markets underperform in election years.
In 17 of the past 23 election years, the S&P 500 index has ended in positive territory. When the index ends an election year below its preceding January 1 level, it’s usually because of larger forces at play. Examples include the dot-com bust of 2000 and the 2008 financial crisis. Because of this, investors would be wise to think long term. Consider that over the past 75 years, through Democratic and Republican administrations, the S&P 500 has had an average annual return of about 11%, historical records show.
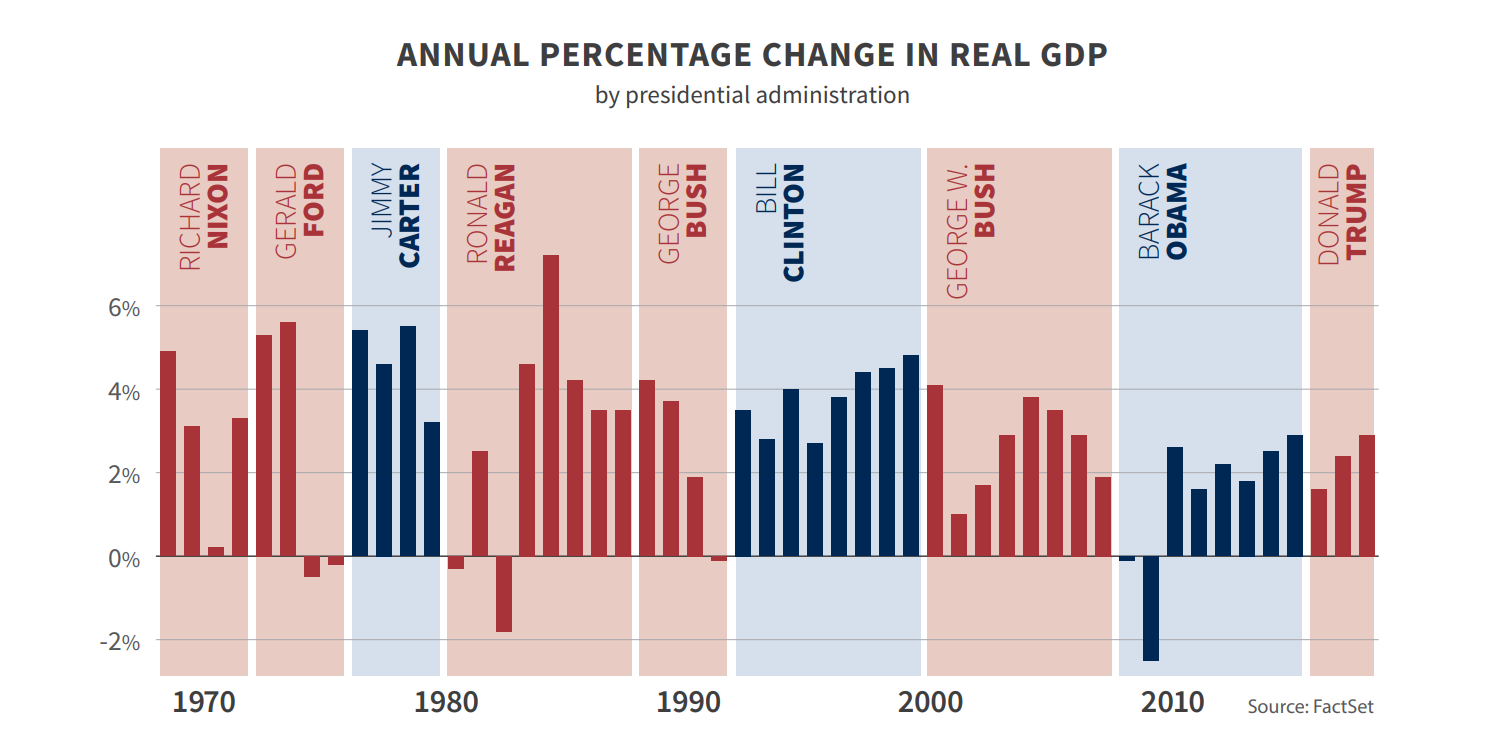
Myth #2: One party can lay claim to superior economic or financial market performance.
A look at past presidential terms shows that markets (as illustrated by the 11% average annual return of the S&P 500 over the past seven decades) and gross domestic product (GDP) are apolitical and have performed well under both major parties.
The growth rate of GDP, one of the most popular indicators of overall economic health in the U.S., has averaged 3% per year from 1948 until present day, according to a Raymond James Investment Strategy analysis. Real GDP decreased 5% on an annualized basis in the first quarter of 2020, and fell a record 32.9% annualized rate in the second quarter due to the COVID-19 crisis. Putting these past two quarters aside, one of the most striking features of the U.S. economy in modern times is its sustained growth over time.
In addition to the pattern of apolitical growth, there is the fact that the U.S. president has only indirect influence over the economy – by design. This is in part because of the separation of powers outlined in the Constitution. Though the executive branch does wield a great deal of power, the checks and balances of American government mean that the credit – and blame – cannot be neatly traced back to a single leader or party.
One must also consider the power of the U.S. Federal Reserve (the Fed), the nation’s central bank. The president doesn’t control monetary policy or interest rates, but the Fed does. It can lower interest rates to encourage borrowing or raise rates to curtail inflation. The Fed usually is averse to changing rates in election years, but it will continue to monitor and respond to the state of the economy regardless.
While there are limits to a president or party’s influence over the economy or the markets, historically, the three months leading up to the presidential election for the equity market has predicted the eventual winner. The S&P 500 trending upward correlates with an incumbent president (or the president’s party) performing well at the polls. The reverse is also true.
Myth #3: U.S. stock markets are weakest in the year after the election of a new president.
This is also known as the Presidential Election Cycle Theory, put forth by Stock Trader’s Almanac founder Yale Hirsch. While it’s more a theory than a myth, it’s worth noting because it tends to be cited during an election year as a way for investors to “time the market.”
According to the theory, the first two years of a presidential term tend to produce below-average returns, while the last two years are well above-average. Theorists say this is because presidents often focus on bolstering the economy late in their term to boost their chances of re-election, or in the case of a second-term president, boost their party’s chances of maintaining control of the White House.
While the data shows a correlation between the election cycle itself and market performance, that doesn’t mean there is causation. Another issue is that many analysts argue the sample size isn’t large enough to draw a definitive conclusion.
Volatility is a reality
There is often a bit of turbulence as Election Day draws nearer, and considering the twists and turns of 2020 so far, volatility may be higher. The fallout from the COVID-19 pandemic, U.S.-China trade negotiations, U.S.-Iran geopolitical tensions and social unrest are just a few of the events influencing the current environment.
The bottom line is that market volatility is likely to increase surrounding the election no matter which political party wins, with growth anticipated over the long term – again no matter which political party is in power. Investors would be prudent to avoid hasty investment decisions based on an election outcome alone. Looking at historical data, staying the course has been the soundest approach.
Next steps
If headlines or market fluctuations have you worried about your financial plan, remain focused on the bigger picture and consider connecting with your advisor before taking action.
Your advisor can help explain how your portfolio is uniquely suited to your risk tolerance and long-term goals, and can also run stress tests to simulate how your plan would perform under different market and economic conditions.
Consider leveraging short-term, election-related volatility to add to favored positions.
All expressions of opinion reflect the judgment of Raymond James & Associates, Inc. and are subject to change. There is no assurance any of the trends mentioned will continue or that any of the forecasts mentioned will occur. Economic and market conditions are subject to change. Investing involves risk including the possible loss of capital. The S&P 500 is an unmanaged index of 500 widely held stocks. It is not possible to invest directly in an index. The market performance noted does not include fees and charges which would affect an investor’s returns. Past performance may not be indicative of future results.
A Healing Economy
Monday Morning Outlook
Brian S. Wesbury, Chief Economist
Robert Stein, Deputy Chief Economist
August 10, 2020
It's going to take years for the US economy to fully heal from the economic disaster brought about by COVID-19 and the government-mandated shutdowns which continue to limit economic activity across the country. When we talk about a full recovery, we don't simply mean getting real GDP back where it was in late 2019; a full recovery comes when the unemployment rate gets back below 4.0%, and we don't see that happening until at least late 2023.
Yet last week's key reports on the economy clearly show we're recovering. The ISM Manufacturing and Service indices, autos sales, and the employment report all beat expectations. The Manufacturing index came in at 54.2, while the sub-indices for new orders and production both exceeded 60.0 for the first time since 2018. The ISM Services index hit a robust 58.1 for July, the highest reading so far this year, including back in January and February when the economy was doing quite well. The new orders sub-index for services hit 67.7, the highest on record (dating back to 1997).
Meanwhile, consumers felt healthy enough to keep increasing auto purchases. Cars and light trucks were sold at a 14.5 million annual rate in July, the highest since February, when sales were 16.8 million annualized. To put this in perspective, auto sales bottomed at an 8.7 million annual rate in April, so this is one sector which is very nearly healed.
Of course, the big news for the week came with Friday's employment report, which showed payrolls expanding faster than anticipated while the unemployment rate declined further. Nonfarm payrolls rose 1.763 million, while civilian employment, an alternative measure of jobs that includes small-business start-ups, increased 1.350 million. Combined with jobs gains in May and June, these figures show that we've recovered roughly 40% of the jobs lost in the carnage of March and April.
The best news was that both average hourly earnings and the total number of hours worked rose in July, with earnings up 0.2% and hours up 1.0%. Recently, these two figures have moved in opposite directions. At first, layoffs tilted toward lower paid workers, which meant average earnings for the remaining workforce were rising while total hours worked fell. Then, as hours rebounded and (disproportionately) lower-paid workers were rehired, the pattern reversed. Now they're rising at the same time.
In addition, recent declines in unemployment claims signal that the improvement in the labor market is continuing. Initial jobless claims came in at 1.186 million in the latest week, 249,000 fewer than the prior week and the lowest level since March. Continuing claims for regular benefits fell 844,000 to 16.1 million, the lowest since April.
It's still early – the initial report on real GDP growth in the third quarter won't be released until October 29 – but plugging all these reports, as well as earlier ones, into our models suggests growth at a 15.0% annual rate.
But along with faster growth, we're also going to see higher inflation. Broad measures of the money supply are growing rapidly, while the Federal Reserve remains committed to keeping short-term rates low as far as the eye can see. The Fed doesn't think we'll hit its 2.0% inflation target until at least 2023. We think inflation will get there, and beyond, before the calendar closes on 2021.
Date/Time (CST) U.S. Economic Data Consensus First Trust Actual Previous
8-11 / 7:30 am PPI – Jun +0.3% +0.3% -0.2%
7:30 am “Core” PPI – Jun +0.1% +0.1% -0.3%
8-12 / 7:30 am CPI – Jun +0.3% +0.3% +0.6%
7:30 am “Core” CPI – Jun +0.2% +0.2% +0.2%
8-13 / 7:30 am Initial Claims Aug 8 1.100 Mil 1.170 Mil 1.186 Mil
7:30 am Import Prices – Jul +0.5% +1.0% +1.4%
7:30 am Export Prices – Jul +0.4% +0.6% +1.4%
8-14 / 7:30 am Retail Sales – Jul +1.9% +1.8% +7.5%
7:30 am Retail Sales Ex-Auto – Jul +1.3% +1.6% +7.3%
7:30 am Q2 Non-Farm Productivity +1.5% +1.0% -0.9%
7:30 am Q2 Unit Labor Costs +5.7% +6.2% +5.1%
8:15 am Industrial Production – Jul +3.0% +2.4% +5.4%
8:15 am Capacity Utilization – Jul 70.3% 70.3% 68.6%
9:00 am Business Inventories – Jun -1.1% -1.1% -2.3%
The attached information was developed by First Trust, an independent third party. The opinions are of the listed authors at First Trust Advisors L.P, and are independent from and not necessarily those of RJFS or Raymond James. All investments are subject to risk. There is no guarantee that these statements, opinions, or forecasts provided in the attached article will prove to be correct. Individual investor's results will vary. Past performance does not guarantee future results. Forward looking data is subject to change at any time and there is no assurance that projections will be realized. Any information provided is for informational purposes only and does not constitute a recommendation. Investing involves risk and you may incur a profit or loss regardless of strategy selected.
The Bottom Fell Out
Monday Morning Outlook
Brian S. Wesbury - Chief Economist
Robert Stein, CFA - Dep. Chief Economist
July 27, 2020
Thursday’s initial report on real GDP growth in the second quarter is going to break records, and not in a good way.
Right now, it looks like the US economy shrank at a 35% annual rate in Q2. To put that in perspective, the worst quarter we’ve ever had since the military wind-down immediately following World War II was -10% in the first quarter of 1958, when, not by coincidence, the US was hit by an Asian flu. This is going to shatter that record by multiples and will likely be the worst since the Great Depression.
However, the US economy has already started recovering and we anticipate a strong report for the third quarter. Compared to the bottom in April, retail sales were up 27.0% in June; industrial production has rebounded 6.9%; housing starts, 27.0%.
Now, imagine retail sales, industrial production, and housing starts, are unchanged in July, August, and September; so, basically we’re flatlined from where we were in June throughout the third quarter. Even in that scenario, average retail sales in Q3 would be up at a 48.5% annual rate versus the Q2 average; industrial production would be up at a 17.2% rate; housing starts at a 66.5% annual rate. As a result, we’re penciling in real GDP growth at a 15% annual rate in Q3, assuming continued reductions in inventories.
This doesn’t mean a full recovery anytime soon. Eventually, the economy will pay a price for recent higher government spending and that price may be an eventual return to the Plow Horse growth of 2009-16. The unemployment rate is unlikely to return below 4.0% until at least 2023.
In the meantime, here’s how we get to our forecast for a 35% decline in real GDP for Q2:
Consumption: Car and light truck sales plunged at a 67.3% annual rate in Q2, while “real” (inflation-adjusted) retail sales outside the auto sector shrank at a 27.7% rate. Spending on services also fell: think restaurants & bars, dry-cleaning, daycare, health care services (outside COVID-19), Uber rides,…etc. The list goes on and on. We estimate that real consumer spending on goods and services, combined, fell at a 31.8% annual rate, subtracting 21.6 points from the real GDP growth rate (-31.8 times the consumption share of GDP, which is 68%, equals -21.6).
Business Investment: Business investment in equipment as well as commercial construction got rocked in Q2. Investment in intellectual property may have continued to rise, but we’re estimating a combined contraction at a 30% annual rate, which would subtract 3.9 points from real GDP growth. (-30 times the 13% business investment share of GDP equals -3.9).
Home Building: Residential construction got beat up like everything else in Q2, although in many places it was considered “essential.” We estimate a contraction at a 32.5% annual rate, which would subtract 1.3 points from the real GDP growth. (32.5 times the 4% residential construction share of GDP equals -1.3).
Government: Growth in national defense spending probably offset a drop in public construction projects in Q2, keeping overall government purchases steady, with zero net effect on real GDP growth in Q2.
Trade: The trade deficit soared in April and May as exports and imports both fell but exports fell even faster. At present, we’re projecting that net exports will subtract an unusually large 3.5 points from real GDP growth in Q2, although data out Wednesday morning in the trade deficit in June may alter this estimate, as well as our estimate for overall real GDP.
Inventories: Looks like inventories plunged at the fastest pace on record in Q2, suggesting a drag on real GDP of 4.7 points.
Add it all up, and we get -35.0% annualized real GDP for the second quarter. The key to remember is that we have already seen the worst of the crisis. The US economy will take years to get back to where it was before COVID-19, but a recovery has already started. Businesses and entrepreneurs have adapted and made the best of an awful situation, including massive government overreach. Better days are headed our way.
Date/Time (CST) U.S. Economic Data Consensus First Trust Actual Previous
7-27 / 7:30 am Durable Goods – Jun +6.8% +7.5% +7.3% +15.7%
7:30 am Durable Goods Ex Trans – Jun +3.6% +4.0% +3.3% +3.7%
7-30 / 7:30 am Initial Claims - Jul 20 1.400 Mil 1.375 Mil 1.416 Mil
7:30 am Q2 GDP Advance Report -35.0% -35.0% -5.0%
7:30 am Q2 GDP Chain Price Index +0.1% -0.5% +1.4%
7-31 / 7:30 am Personal Income – Jun -0.7% -0.8% -4.2%
7:30 am Personal Spending – Jun +5.4% +5.5% +8.2%
8:45 am Chicago PMI 43.9 42.5 36.6
9:00 am U. Mich Consumer Sentiment- Jul 72.8 73.5 73.2
The attached information was developed by First Trust, an independent third party. The opinions are of the listed authors at First Trust Advisors L.P, and are independent from and not necessarily those of RJFS or Raymond James. All investments are subject to risk. There is no guarantee that these statements, opinions, or forecasts provided in the attached article will prove to be correct. Individual investor's results will vary. Past performance does not guarantee future results. Forward looking data is subject to change at any time and there is no assurance that projections will be realized. Any information provided is for informational purposes only and does not constitute a recommendation. Investing involves risk and you may incur a profit or loss regardless of strategy selected.
There's No Such Thing As A Free Lunch
Monday Morning Outlook
Brian S. Wesbury, Chief Economist
Robert Stein, Deputy Chief Economist
7/20/2020
“There is no such thing as a free lunch.” It’s been attributed to many different people, Milton Friedman and Robert Heinlein, among others. Regardless of who said it, we think it’s one of the most basic economic truths.
A lunch has to come from somewhere, and once it is consumed, it’s not available for someone else to consume. ‘Another way to say it, someone needs to produce what we consume. Supply comes before demand. Without supply – without production – we have nothing to bring to “the market” in exchange for something else. In Venezuela, production has plummeted due to socialist government policies, while inflation and hunger run rampant.
And the US is facing problems as well. Recent reports show a huge gap between supply and demand, a gap that can’t go on indefinitely. Retail sales in the US, a measure of demand, fell off a cliff in March and April, bottoming 21.7% below the level in February. Since then, retail sales have rebounded sharply, rising 18.2% in May and 7.5% in June. Amazingly, retail sales are now 1.1% higher than a year ago, during a time where unemployment has climbed from 3.7% to 11.1%.
By contrast, industrial production – one proxy for supply – hasn’t done as well. Industrial production fell a combined 16.6% in March and April and has since risen a more modest 6.9% combined in May and June, leaving it down 10.8% from a year ago.
How can Americans go out and buy more when they’re making less? The answer: borrowing from the future through government deficits. Government transfer payments in April and May, combined, were up 86.7% from a year ago due to COVID spending on “tax relief” checks that have been sent out by the IRS, as well as a surge in unemployment compensation, mostly because of more people collecting benefits, but also because benefits were increased substantially.
As a result, government transfer payments made up 30.6% of all personal income in April and 26.4% in May. Let’s say that again…government made up over 25% of all personal income in May!! From 2015 through February 2020, government transfers averaged roughly 17% of all consumer income. Prior to the Panic of 2008, transfer payments averaged 14%. This year, government transfer payments have been so generous that they’ve more than offset declines in wages & salaries and small business income.
Normally, the gap between the growth in retail spending and industrial production would be a sign that something is systematically wrong with the economy, and higher inflation is not long to follow. The only way people can spend more without producing more is if they’re spending inflationary dollars. That’s not a free lunch; it’s just that the cost of the lunch is paid for by reducing the value of all the money we use. (Sneaky, sneaky.)
The Federal Reserve has all but promised to remain loose for the foreseeable future. We haven’t seen this kind of monetary policy since the 1970s.
Consumer prices rose 0.6% in June, although, given steep price declines in March and April, consumer prices are still up only a modest 0.6% from a year ago. So we don’t have deflation, but for now signs of runaway inflation remain scarce.
One reason is that the personal saving rate has surged. The personal saving rate is the share of our after-tax income that we don’t spend on consumer goods or services. It hit 32.2% in April, the highest level on record - by far - going back to at least 1959. The next highest level was 17.3% in May 1975, and the average rate last year was 7.9%. The saving rate remained at a still elevated 23.2% in May.
The fact that people are not rushing out all at once to spend their transfer-padded incomes has helped keep inflation in check. The gap between consumer spending and production has also come in the form of big reductions in business inventories, a reduction that can’t continue forever (eventually, we’d run out of inventories to reduce).
We aren’t looking for hyper-inflation, but we do think the Fed is likely underestimating future price increases. The Fed expects the PCE deflator to rise 0.8% this year, 1.6% in 2021, and 1.7% in 2022. We’d take the OVER on all three.
Date/Time (CST) U.S. Economic Data Consensus First Trust Actual Previous
7-22 / 9:00 am Existing Home Sales – Jun 4.800 Mil 4.660 Mil 3.910 Mil
7-23 / 7:30 am Initial Claims - Jul 18 1.293 Mil 1.250 Mil 1.300 Mil
7-24 / 9:00 am New Home Sales – Jun 0.700 Mil 0.710 Mil 0.676 Mil
The attached information was developed by First Trust, an independent third party. The opinions are of the listed authors at First Trust Advisors L.P, and are independent from and not necessarily those of RJFS or Raymond James. All investments are subject to risk. There is no guarantee that these statements, opinions, or forecasts provided in the attached article will prove to be correct. Individual investor's results will vary. Past performance does not guarantee future results. Forward looking data is subject to change at any time and there is no assurance that projections will be realized. Any information provided is for informational purposes only and does not constitute a recommendation. Investing involves risk and you may incur a profit or loss regardless of strategy selected.
A Father’s Letter to His Kid: The 9 Money and Life Lessons Most People Learn Too Late in Life

Morgan Housel - CNBC Contributor
June 6, 2020
On June 3, 2019, my wife and I welcomed our daughter into the world. She’s barely old enough to walk, so her job (mostly eating and sleeping) hasn’t changed much.
But, one day, she’ll need some money and life advice. As a father who has spent much of his career studying and writing about money, behavioral finance and business, this is what I’ll tell her:
1. Don’t underestimate the role of chance in life.
It’s easy to assume that wealth and poverty are caused by the choices we make, but it’s even easier to underestimate the role of chance in life.
The families, values, countries and generations we’re born into, as well as the people we happen to meet along the way, all play a bigger role in our outcomes than most people want to admit.
While you should believe in the values and rewards of hard work, it’s also important to understand that not all success is a result of hard work, and that not all poverty is due to laziness. Keep this in mind when forming opinions about others, including yourself.
2. The highest dividend money pays is the ability to control time.
Being able to do what you want, when you want, where you want, with who you want and for as long as you want provides a lasting level of happiness that no amount of “fancy stuff” can ever offer.
The thrill of having fancy stuff wears off quickly. But a job with flexible hours and a short commute will never get old. Having enough savings to give you time and options during an emergency will never get old. Being able to retire when you want to will never get old.
Achieving independence is our ultimate goal in life. But independence isn’t an “all-or-nothing” — every dollar you save is like owning a slice of your future that might otherwise be managed by someone else, based on their priorities.
3. Don’t count on getting spoiled.
No one can grasp the value of a dollar without experiencing its scarcity, so while your mother and I will always do our best to support you, we’re not going to spoil you.
Learning that you can’t have everything you want is the only way to understand needs versus desires. This in turn will teach you about budgeting, saving, and valuing what you already have.
Knowing how to be frugal — without it hurting you — is an essential life skill that will come in handy during life’s inevitable ups and downs.
4. Success doesn’t always come from big actions.
Napoleon’s definition of a genius is the person “who can do the average thing when everyone else around him is losing his mind.”
Managing money is the same. You don’t have to do amazing things to end up in a good place over time, you just have to consistently not screw up for long periods of time.
Avoiding catastrophic mistakes (the biggest of which is burying yourself in debt) is more powerful than any fancy financial tip.
5. Live below your means.
The ability to live with less is one of the most powerful financial levers, because you’ll have more control over it than things like your income or investment returns.
The person who makes $50,000 per year, but only needs $40,000 to be happy, is richer than the person who makes $150,000, but needs $151,000 to be happy. The investor who earns a 5% return, but has low expenses, may be better off than the investor who earns 7% a year, but needs every penny of it.
How much you make doesn’t determine how much you have, and how much you have doesn’t determine how much you need.
6. It’s okay to change your mind.
Almost no one has their life figured out by age 18, so it’s not the end of the world if you pick a major that you end up not enjoying. Or get a degree in a field that you’re not 100% passionate about. Or work in a career and later decide you want to do something else.
It’s okay to admit that your values and goals have evolved. Forgiving yourself for changing your mind is a superpower, especially when you’re young.
7. Everything has a price.
The price of a busy career is time away from friends and family. The price of long-term market returns is uncertainty and volatility. The price of spoiling kids is them living a sheltered life.
Everything worthwhile comes with a price, and most of those prices are hidden. They’re sometimes worth paying for, but you should never ignore their true costs.
Once you accept this, you’ll start to view things like time, relationships, autonomy and creativity as currencies that are just as valuable as cash.
8. Money is not the greatest measure of success.
Warren Buffett once said: True success in life is “when the number of people you want to have love you actually do love you.”
And that love comes overwhelmingly from how you treat people, rather than your level of net worth. Money won’t provide the thing that you (and almost everyone else) want most. No amount of money can compensate for a lack of character, honesty and genuine empathy towards others.
This is the most important financial advice I can give you.
9. Don’t blindly accept any advice you’re given.
All the lessons here, including this last one, are things that most people learn too late in life. But feel free to reject them.
Your world will be different from mine, just as mine is different from my parents. No one is exactly is the same, and no one has all the right answers. Never take anyone’s advice without contextualizing it with your own values, goals and circumstances.
Your parents love you. We are so happy you’re here. Please let us sleep.