Is the Job Market Really That Strong?

First Trust Monday Morning Outlook

Brian S. Wesbury - Chief Economist

Robert Stein, CFA - Dep. Chief Economist

March 11, 2024

If you only look at the headlines about the monthly payroll report, the job market has looked surprisingly strong in recent months. Nonfarm payrolls rose 275,000 in February, beating the consensus expected 200,000 as well as the average of 229,000 per month in the past year.

But a deeper look at the data makes it look about as fishy as week-old sushi. Now, we’re not alleging some sort of “Deep State” conspiracy, we’ll leave that to others. But reviewing the report in its entirety show the job market is not nearly as strong as the top line payroll readings suggest.

For example, look at the revisions. Payrolls in December and January were revised down by a total of 167,000 (the largest monthly downgrade for any non-shutdown months since late 2008), meaning February was just 108,000 above the original January level. And it was even worse in the private sector, where payroll gains were a paltry 19,000 for the month after netting out revisions for prior months.

What’s odd about these downward revisions is that they seem to happen pretty darn often of late. In 2023, for example, the regular two-month revision process reduced the initial monthly report by 30,000, on average. That ain’t chump change. In the past few decades, negative revisions like this have normally been associated with recessions or the immediate aftermath of recessions.

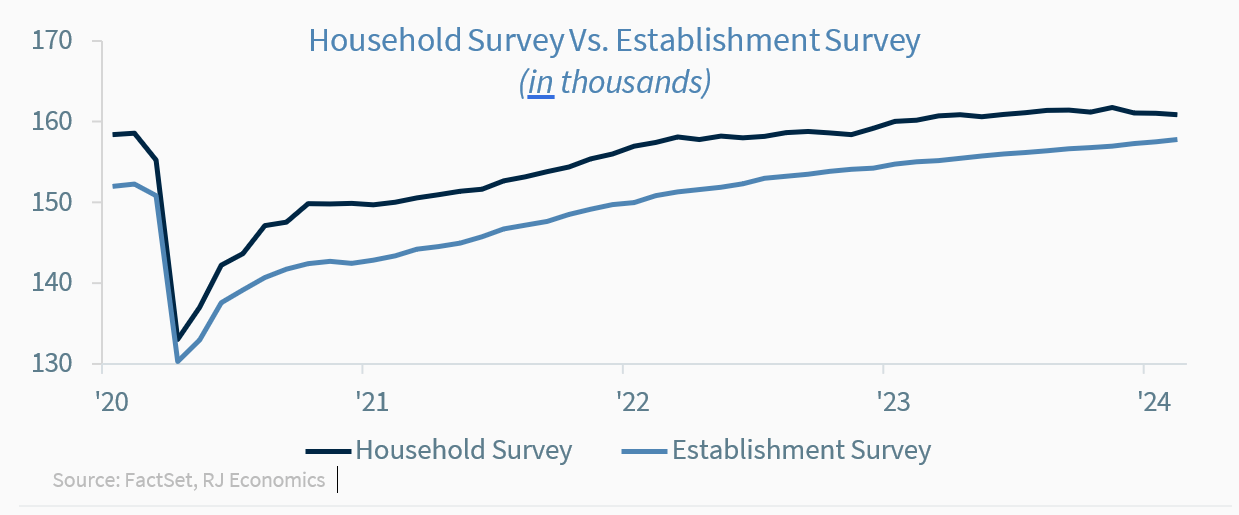
It's also important to follow civilian employment, an alternative measure of jobs that includes small-business start-ups. On a monthly basis, these figures are volatile, and are affected by estimates of the size of the total population, so take them with a grain of salt. But the trend is important and isn’t anywhere as strong as payrolls. While payrolls are up 2.7 million in the past year, civilian employment is up 0.7 million and the unemployment rate has risen to 3.9%. Moreover, the gain in civilian employment in the past year has all come in part-time work, with a slight loss for full-time jobs.

There may be solid technical reasons for this large gap. The figures are generated by two different surveys (one for employers, the other for households), and maybe the massive influx in immigrants, even if largely illegal, is finding its way into payroll expansion (perhaps with illegal hiring or false documents) in a way not being picked up by the civilian survey. We’re guessing many recent immigrants are not eager to answer surveys sent by the Labor Department.

Notably, among those who do answer the survey, civilian employment among the native-born population is down around 900,000 from a year ago – the first drop since the onset of COVID – versus an increase of about 1.5 million among the foreign-born.

Only time will tell the true underlying health of the labor market. There is no clear signal we’re in a recession, but the patient isn’t looking well. What is clear, is that economic risks abound, and a soft landing is far from guaranteed.

The attached information was developed by First Trust, an independent third party. The opinions are of the listed authors at First Trust Advisors L.P, and are independent from and not necessarily those of RJFS or Raymond James.  All investments are subject to risk. There is no guarantee that these statements, opinions, or forecasts provided in the attached article will prove to be correct. Individual investor's results will vary. Past performance does not guarantee future results. Forward looking data is subject to change at any time and there is no assurance that projections will be realized. Any information provided is for informational purposes only and does not constitute a recommendation. Investing involves risk and you may incur a profit or loss regardless of strategy selected.

Is a Debt Spiral Already Here?

First Trust Monday Morning Outlook

Brian S. Wesbury - Chief Economist

Robert Stein, CFA - Dep. Chief Economist

March 4, 2024

Washington DC continues to spend much more than it gets in revenue. In the Calendar Year of 2023, the federal government spent $6.3 trillion, but only collected $4.5 trillion in taxes. This $1.8 trillion gap drove the national debt to $34 trillion in December 2023. And it is only going higher.

One problem with these budget numbers is that government accountants, rightly or wrongly, lowered spending in 2023 by about $300 billion after the Supreme Court struck down a large part of President Biden’s proposal to forgive student loans. That legal decision didn’t change the government’s cash flow last year in any significant way, but it did let the Department of Education “write up” the value of its loan portfolio by about $300 billion. This, they counted as “negative spending,” which then reduced the official budget deficit. So, while the reported deficit in 2023 was $1.8 trillion, the Treasury needed to borrow more than $2 trillion to make ends meet.

The high levels of borrowing are causing some investors to fear some sort of imminent and unprecedented snowballing of federal debt. Continual borrowing will lead to skyrocketing interest rates (and higher interest payments), which will lead to severe problems in the financial system.

In particular, they note that since June 2023, when the debt ceiling was suspended, total Treasury debt outstanding has gone up by nearly $3 trillion. That includes a total of $874 billion in the second quarter of 2023, $835 billion in the third quarter, and $834 billion in the fourth quarter. Other than 2020-21, during COVID lockdowns, the debt has never gone up this rapidly, not even in 2008-2009.

But it’s important to remember that the debt does not go up at a steady rate during the course of the year. In 2023, during March and April, the federal government received a surge in tax receipts, which temporarily reduced the amount of debt outstanding. We think this will happen again this year, particularly because the S&P 500 went up 24% last year and the federal government is therefore likely to reap lots of non-withheld revenue.

As a result, the Congressional Budget Office estimates that individual income tax payments will be up 13.4% this year and the budget deficit will come in at roughly $1.5 trillion versus $1.7 trillion in Fiscal Year 2023. On that score, we are not as optimistic. Even as we write this, Congress is debating foreign aid measures that, whether you like the underlying policy or not, will, by themselves, boost the deficit.

And while the cost of servicing the debt is going up, the interest measure that matters is the net interest on the debt relative to GDP. In other words, what matters is how much of our national income is needed to service the debt. That measure, while climbing and a problem, is still below the average of roughly 3% of GDP it was back in the 1980s-90s.

However, because we think interest rates will remain higher than government accountants think, the carrying cost of our debt will move higher.

The bottom line is that federal government spending is way too high and most politicians do not seem to care. There are those who look at these numbers and assume some kind of imminent crisis, when what we see is a slow, but unavoidable decay in our underlying potential to grow. New technologies are raising productivity, but a huge government acts like a ball and chain on those benefits.

For now, the markets are ignoring this, and assume a soft landing with lower interest rates. But the more economic growth is undermined, the less likely this outcome.

The attached information was developed by First Trust, an independent third party. The opinions are of the listed authors at First Trust Advisors L.P, and are independent from and not necessarily those of RJFS or Raymond James.  All investments are subject to risk. There is no guarantee that these statements, opinions, or forecasts provided in the attached article will prove to be correct. Individual investor's results will vary. Past performance does not guarantee future results. Forward looking data is subject to change at any time and there is no assurance that projections will be realized. Any information provided is for informational purposes only and does not constitute a recommendation. Investing involves risk and you may incur a profit or loss regardless of strategy selected.

Watching the Fed

First Trust Monday Morning Outlook

Brian S. Wesbury - Chief Economist

Robert Stein, CFA - Dep. Chief Economist

February 26, 2024

Every day this week, investors will get data on the economy. New home sales today, then capital investment, GDP, consumer incomes and spending, manufacturing, and auto sales are on the list. All of this will feed into the outlook for what the Federal Reserve might do with interest rates this year.

Pretty much everyone expects the Fed to cut rates this year, but expectations have changed. A month ago, the futures market was pricing in five or six twenty-five basis point (bps) rate cuts in 2024 (125 - 150 bps in total); now the market is pricing in three or four (75 - 100 bps total). Two relatively strong employment reports and an upside surprise with Q4 GDP data caused some rethinking, but this could be reversed just as easily.

While all these data points matter, we will be watching another release very closely, as well, one that few investors pay attention to and the Fed itself either doesn’t care about or is doing a great job pretending it doesn’t care about: tomorrow afternoon’s report on the growth of the money supply, or lack thereof, the M2 measure of money, in particular.

That measure of money, in spite of QE, did not soar during the Great Recession and Financial Crisis of 2008-09, and therefore did not cause inflation. The main reason is that though the Fed did trillions in QE, through heavy-handed regulation, banks were forced to boost reserves.

But 2020-21 was different. Banks were paid to push the money into the economy (remember PPP loans?) and M2 skyrocketed 40.7%. This led to the surge in inflation that followed in 2021-22. Since then, M2 has actually declined 3.2% in 2022-23, taking the steam out of inflation, but so far hasn’t affected economic growth.

But in the last two months of 2023, M2 started growing at a moderate pace again, up at a 4.1% annualized rate. If the Fed keeps it up, not just for one month but as a trend, that would be good news and might even reduce the risk of a recession later this year.

While we watch M2, others have been eyeing the relationship between long and short interest rates. In October 2022, the 3-month Treasury yield rose above the 10-year yield, and has stayed there. This is called an “inverted yield curve” and historically signals that the Fed is tight and a recession is often on the way.

But in an “abundant reserve” monetary policy, higher short-term interest rates no longer signal “tight” reserves. In fact, with reserves so abundant, the Federal Funds Rate is no longer determined in a market, but is actually set at the whim of the Fed. Technically, this is price fixing.

So, the yield curve doesn’t mean what it once did. Longer-term bond yields now are hugely affected by what investors think the Fed might do with rates, rather than how those rates reflect underlying economic trends. The Fed has convinced itself and the markets, that it can move rates up and down with the economic data perfectly, but this is hubris. The Fed has held interest rates below inflation roughly 80% of the time since 2009, leading to distortions in markets and the banking system.

Having said that, with short-term rates no longer excessively low, and the money supply down in the past 18 months, we believe the economy is starting to falter.

Retail sales have declined in three of the past four months. Manufacturing production, excluding the auto sector has declined four months in a row. Meanwhile, home building got hammered, with both housing starts (-14.8%) and completions (-8.1%) dropping sharply while new home sales are down 5.3% in the past four months.

We advise watching the path of M2 to tell how much additional faltering it will do in the year ahead.

The attached information was developed by First Trust, an independent third party. The opinions are of the listed authors at First Trust Advisors L.P, and are independent from and not necessarily those of RJFS or Raymond James.  All investments are subject to risk. There is no guarantee that these statements, opinions, or forecasts provided in the attached article will prove to be correct. Individual investor's results will vary. Past performance does not guarantee future results. Forward looking data is subject to change at any time and there is no assurance that projections will be realized. Any information provided is for informational purposes only and does not constitute a recommendation. Investing involves risk and you may incur a profit or loss regardless of strategy selected.
January Stagflation

First Trust Monday Morning Outlook

Brian S. Wesbury - Chief Economist

Robert Stein, CFA - Dep. Chief Economist

February 20, 2024

A key economic mistake people make is thinking growth leads inflation. One reason they do that is because inflation is a monetary phenomenon. When money is too easy, first growth rises, and then inflation rises with a longer lag due to excess dollars in the system. This process reverses when money is tight, first growth slows, then with a longer lag inflation does too.

That makes 2023 an anomaly. The economy has remained resilient, but year-over-year consumer price inflation has moderated from a peak of 9.1% in mid-2022 to 3.4% in December 2023.

One theory is that the high inflation was all due to economic bottlenecks and supply constraints during COVID, so the end of lockdowns and the process of getting back to normal has expanded supply, leading to both faster growth and lower inflation. There’s no doubt that the imposition of lockdowns and then the re-opening from those lockdowns had “supply-side” effects – first negative, then positive – and are consistent with this explanation.

But it’s a flawed explanation. If supply constraints and their loosening were the key drivers of inflation, we would expect pandemic driven inflation to be followed by outright deflation as the economy reopened and returned to normal. That clearly hasn’t happened, and inflation remains stubbornly high.

Instead, we believe monetary policy played the key role. The M2 measure of the money supply soared 41% in 2020-21, the fastest since World War II. This measure of the money supply then declined 3.2% in 2022-23, the largest two-year drop since the Great Depression. These swings in M2, the relative sizes of the swings (larger up than down), and the long lags between shifts in M2 and inflation do a much better job explaining the inflation pattern of the past few years.

The problem with this theory of “monetary dominance” is that classical liberals like Milton Friedman and the Austrians would expect economic growth to take a hit before inflation were brought back down to normal. And yet Real GDP grew 3.1% in 2023, which is above the 2.0% long-term trend.

So what gives? Our belief is that the US injected so much money, so rapidly, that the economy couldn’t absorb it instantaneously. So, now, what we have seen is that even though M2 has declined, we still haven’t absorbed all the money that was added. Some call it excess savings, we call it excess M2.

But the US has finally absorbed the excess money, and fiscal stimulus is waning as well. And guess what? Recent reports for January show an economy that may be weakening faster than most investors realize. Retail sales fell 0.8% for the month and have declined in three of the past four months. Manufacturing production fell 0.5% in January and manufacturing excluding the auto sector (the auto sector is volatile) has declined four months in a row.

Meanwhile, home building got hammered in January, with both housing starts (-14.8%) and completions (-8.1%) dropping sharply. It’s possible that colder than normal January temperatures were a factor, as well as unusually high precipitation, but the drop in starts was in every major region of the country, the drop in completions happened in most regions (except for the West), and while weather was bad, quantitative measures of national heating requirements were not unusually high in January.

We’ve had bad weather before – and apocalyptic weather reports are clearly clickbait for some in the news media – but housing starts in January were the second lowest for any month since mid-2020, during the onset of COVID when lockdowns still prevailed in much of the country. In other words, we see these data potentially signaling broader economic weakness, consistent with the drop in retail sales and decline in manufacturing production in January.

And yet inflation was also a problem in January, with both consumer and producer prices rising 0.3%, faster than the consensus expected and inconsistent with the Federal Reserve’s 2.0% target inflation.

A weakening US economy with inflation remaining (temporarily) stubbornly high would be consistent with the monetary dominance story of inflation’s rise and fall and would also be a problem for the stock market. Using our Capitalized Profits Model, with a 10-year Treasury yield at about 4.25%, economy-wide corporate profits would need to rise 30%+ to justify an S&P 500 at 5,000. But there’s no way profits (ex-Fed), which are already high relative to GDP would surge that much higher in a soft economy. The current consensus puts profit growth at roughly 10% this year.

Time will tell if the weakness in January becomes more widespread. On the surface, the job market still looks fine, with payrolls up more than 300,000 in both December and January. But the labor market can be a lagging indicator.

Unprecedented policies during COVID have created noise in the data. But underneath it all, we still believe Milton Friedman had it right. A decline in money will lead to recession, and then a decline in inflation.

The attached information was developed by First Trust, an independent third party. The opinions are of the listed authors at First Trust Advisors L.P, and are independent from and not necessarily those of RJFS or Raymond James.  All investments are subject to risk. There is no guarantee that these statements, opinions, or forecasts provided in the attached article will prove to be correct. Individual investor's results will vary. Past performance does not guarantee future results. Forward looking data is subject to change at any time and there is no assurance that projections will be realized. Any information provided is for informational purposes only and does not constitute a recommendation. Investing involves risk and you may incur a profit or loss regardless of strategy selected.

CBO’s Rosy Scenario

First Trust Monday Morning Outlook

Brian S. Wesbury - Chief Economist

Robert Stein, CFA - Dep. Chief Economist

February 12, 2024

Last week the Congressional Budget Office set out new projections for budget deficits and debt in the decade ahead, and they weren’t quite as bad as they looked last year. The CBO now projects a deficit of 6.4% of GDP in 2033 versus a prior forecast of 7.3%. Total accumulated debt by 2033 is now forecasted to be 114% of GDP versus 119%. None of this is “good” news – deficits and debt would still be too high – but it is “less bad.”

The problem is that the CBO’s assumptions are way too rosy. In particular, it assumes the end of many of the tax cuts enacted in 2017 without any negative effects on the economy. Fat chance! More likely, growth would slow and revenue would come in low, meaning bigger budget deficits.

But it will also be tough to hit the CBO’s revenue projections if we keep the 2017 tax cuts fully in place. The CBO is forecasting “real” (inflation-adjusted) economic growth of about 2.0% per year, on average for the decade ahead, the same growth we’ve experienced since the end of 2000 (before the 2001 recession) and since the end of 2019 (the business cycle peak prior to COVID). If we tax that economy at lower rates than CBO projects it’ll yield less revenue than CBO projects, as well.

The bottom line is that no matter what candidates say this year on the campaign trails in their races for the White House, Senate, and House, both parties are going to have to find ways to limit deficits in the years ahead. If we get a GOP sweep – which we believe would result in a continuation of the 2017 tax cuts (and on which we put 35% odds, up from 30% last November) – we expect measures to fight the deficit to include curbs on “green energy” subsidies, more tariffs, and Medicaid reform.

If the Democrats sweep (20% odds) then we think a wide range of tax hikes will be on the table, including raising the top income tax rate (now 37%) back to 39.6%, raising the top longterm capital gains and dividends tax rates (now 20%) to at least 24%, reducing estate tax exemptions, raising the standard corporate tax rate (now 21%) to 35%, and possibly introducing a carbon tax, which the Clinton Administration very briefly considered in 1993. Back then, both Senators from Nebraska were Democrats, which helped keep President Clinton away from a carbon tax; now the Democrats get very little support from energy-intensive states.

But in a world where the current House majority is razor thin and some election maps are still being redrawn, it shouldn’t shock anyone if we end up with “mixed government” in 2025- 26, with the GOP holding at least one of the White House, Senate, and House, and the Democrats holding at least one, as well. We’d put the odds on that at about 40-45%, at present.

With mixed government, expect some brutal political fights. Does anyone think a Speaker Hakeem Jeffries would simply rollover for a Republican president and accept a full extension of the 2017 tax cuts, or anything close? Why wouldn’t a Republican president test the Supreme Court by “impounding” (refusing to spend) money appropriated by Congress, which hasn’t happened since the early 1970s? The bottom line is that for all the fighting, mixed government scenarios would likely generate no entitlement reforms and little deficit reduction, leaving plenty of time for the bond vigilantes to sharpen their knives.

The attached information was developed by First Trust, an independent third party. The opinions are of the listed authors at First Trust Advisors L.P, and are independent from and not necessarily those of RJFS or Raymond James.  All investments are subject to risk. There is no guarantee that these statements, opinions, or forecasts provided in the attached article will prove to be correct. Individual investor's results will vary. Past performance does not guarantee future results. Forward looking data is subject to change at any time and there is no assurance that projections will be realized. Any information provided is for informational purposes only and does not constitute a recommendation. Investing involves risk and you may incur a profit or loss regardless of strategy selected.

Labor Market Not Adding Up

First Trust Monday Morning Outlook

Brian S. Wesbury - Chief Economist

Robert Stein, CFA - Dep. Chief Economist

February 5, 2024

On the surface, there’s much to like about the job market. But when you get into the details, it’s not quite as strong and some things don’t add up.

Here’s what to like.

The establishment survey answered by a sample of businesses showed that nonfarm payrolls increased 353,000 in January, easily beating the consensus expected 185,000, the largest gain in a year, and coming in higher than the forecast from every economics group (that filed a forecast with Bloomberg). Meanwhile, payroll gains were revised up by 126,000 for November and December, bringing the net gain, including revisions, to 479,000. In the past year, payrolls are up 2.9 million or 244,000 per month.

We like to follow payrolls excluding government (because it's not the private sector), education & health (because it rises for structural and demographic reasons, and usually doesn’t decline even in recession years), and leisure & hospitality (which is still recovering from COVID Lockdowns). That “core” measure of payrolls rose 194,000 in January, which is the best month since mid-2022.

That same payroll survey showed that average hourly earnings – cash earnings, excluding irregular bonuses/commissions and fringe benefits – rose 0.6% in January and are up 4.5% versus a year ago. The Federal Reserve might not like that – the odds implied by the futures market that the Fed will cut rates by the end of the May 1 meeting went down substantially – but it is good news for workers and means wage growth per hour is out-stripping inflation.

Meanwhile, the survey that samples US households showed that the unemployment rate remained at 3.7%.

But here are the details and figures that make us wary about just accepting all the good news at face value.

First, the same payroll survey showing strong job growth is showing a concerning drop in the number of hours per worker. Workers in the private sector worked an average of 34.6 hours per week in January 2023; this January they were down to 34.1. Average weekly hours haven’t been this low since March 2020, with the onset of COVID.

As a result, even though total jobs are up 1.9% in the past year, total hours worked are up only 0.3%. To put this in perspective, a 0.3% increase in private-sector jobs in the past year would have meant private payroll gains of 33,000 per month, not the 194,000 per month we experienced. (A 0.3% gain in jobs is what would have happened if businesses had hired workers to fill the extra hours they needed but kept the number of hours per worker the same.)

Second, the household survey measure of employment hasn’t been rising nearly as fast as payrolls, which is something that has happened in the past prior to recessions. As we noted earlier, nonfarm payrolls (which includes government workers) are up 244,000 per month in the past year. But the household survey (smoothed for recent population adjustments) is up only 101,000 per month in the past year. That’s a very large gap by historic standards.

Another issue is the oddity of having payroll growth of 244,000 per month in the past year while the unemployment rate has been so low. Since February 2001, right before the 2001 recession, payrolls have grown at an average pace of 91,000 per month. Since February 2020, right before COVID, payrolls have grown at an average pace of 115,000 per month. Those longer-term averages make sense given a growing population in the context of an aging workforce.

But how then can we have payroll growth so much faster in the past year, particularly when the unemployment rate is already so low? Usually job growth gets slower when the jobless rate is near bottom.

One theory can explain this, however: that the US economy has been temporarily boosted by having the government run a larger budget deficit, including the effects of the CHIPS Act, infrastructure bill, and the Inflation Reduction Act. But that artificial boost should soon come to an end. And when it does job growth should slow sharply, as well.

A strong job market is a good thing, but it doesn’t mean a recession can’t start soon. Payrolls are up 1.9% in the past year. But they were up the same in the year ending in January 1990 and a recession started mid-year. They were up 1.3% in the year ending January 2001 and a recession started in Spring 2001. The flu starts when you’re feeling good and it’s normal for a recession, like the flu, to come when the economy looks fine.

The attached information was developed by First Trust, an independent third party. The opinions are of the listed authors at First Trust Advisors L.P, and are independent from and not necessarily those of RJFS or Raymond James.  All investments are subject to risk. There is no guarantee that these statements, opinions, or forecasts provided in the attached article will prove to be correct. Individual investor's results will vary. Past performance does not guarantee future results. Forward looking data is subject to change at any time and there is no assurance that projections will be realized. Any information provided is for informational purposes only and does not constitute a recommendation. Investing involves risk and you may incur a profit or loss regardless of strategy selected.

Did You Know 529s Are Powerful Estate Planning Tools?

Raymond James

Family & Lifestyle

These versatile savings accounts might be the estate planning vehicle you need to learn about.

Most of us associate 529 accounts as college savings vehicles. They’re flexible, allowing you to transfer assets to anyone, including yourself, for the express purpose of furthering the education of your beneficiary. But did you know that a 529 can be a powerful estate planning tool, too?

Modern estate planning

Not everyone is in a position to set aside money for the next generation without jeopardizing their own goals, but if you’re fortunate enough to do so, it’s worth looking into your options.
Specialized savings accounts, informally referred to as 529s, could be at the top of your list. They have quite a few advantages for the beneficiaries – but there are benefits for the donors too, given the high maximum contribution limits and tax advantages.

The special tax rules that govern these accounts allow you to pare down your taxable estate, potentially minimizing future federal gift and estate taxes. Right now, the lifetime exclusion is $13.61 million per person, so most of us don’t have to worry about our estates exceeding that limit.

The framework

Under the rules that uniquely govern 529s, you can make a lump-sum contribution to a 529 plan up to five times the annual limit of $18,000. That means you can gift $90,000 per recipient ($180,000 for married couples) as long as you denote your five-year gift on your federal tax return and do not make any more gifts to the same recipient during that five-year period. However, you can elect to give another lump sum after those five years are up. In the meantime, your investments have the luxury of time to compound and potentially grow.

So, if you’re following along, that $180,000 gift per beneficiary won’t incur gift tax as long as you and your spouse follow the rules. You’ll also whittle your taxable estate by that same amount, potentially reducing future estate tax liabilities. That’s because contributions to 529s are considered a completed gift from the donor to the beneficiary.

Other benefits

Many people worry that gifting large chunks of money to a 529 means they’ll irrevocably give up control of those assets. However, 529s allow you quite a bit of control, especially if you title the account in your name. At any point, you can get your money back. Of course, that means it becomes part of your taxable estate again subject to your nominal federal tax rate, and you’ll have to pay an additional 10% penalty on the earnings portion of the withdrawal if you don’t use the money for your designated beneficiary’s qualified education expenses. 

If your chosen beneficiary receives a scholarship or financial aid, they may not need some or all of the money you’ve stashed away in a 529. So you’ve got options here, too.

  • You can earmark the money for other types of education, like graduate school.

  • You can change the beneficiary to another member of the family (ideally in the same generation), as many times as you like, since most 529s have no time limits. This option is particularly helpful if your original beneficiary chooses not to go to college at all.

  • You can take the money and pay the taxes on any gains. Normally, you’d expect to pay a penalty on the earnings, too. But that’s not the case for scholarships. The penalty is waived on amounts equal to the scholarship as long as they’re withdrawn the same year the scholarship is received, effectively turning your tax-free 529 into a tax-deferred investment. Of course, you can always use the funds to pay for other qualified education expenses, like room and board, books and supplies, too.

  • Starting in 2024, funds in a 529 plan can be rolled into a Roth IRA for the beneficiary if the 529 plan account meets certain requirements. Consult with a tax professional about this option and whether the 529 plan account is qualified for this rollover option.

Plus, many plans offer you several investment choices, including diversified portfolios allocated among stocks, bonds, mutual funds, CDs and money market instruments, as well as age-based portfolios that are more growth-oriented for younger beneficiaries and less aggressive for those nearing college age.

Bottom line

Saving for college takes discipline, as does estate planning. Talk to your professional advisor about the nuances of different investment strategies and vehicles before making a years-long commitment.

Sources: Mercer; Broadridge/Forefield

Earnings in 529 plans are not subject to federal tax and in most cases state tax, as long as you use withdrawals for eligible college expenses, such as tuition and room and board. However, if you withdraw money from a 529 plan and do not use it on an eligible higher education expense, you generally will be subject to income tax and an additional 10% federal tax penalty on earnings. As with other investments, there are generally fees and expenses associated with participation in a 529 plan. There is also a risk that these plans may lose money or not perform well enough to cover college costs as anticipated. Most states offer their own 529 programs, which may provide advantages and benefits exclusively for their residents. An investor should consider, before investing, whether the investor’s or designated beneficiary’s home state offers any state tax or other benefits that are only available for investments in such state’s qualified tuition program. Such benefits include financial aid, scholarship funds, and protection from creditors. The tax implications can vary significantly from state to state.

Please note, changes in tax laws may occur at any time and could have a substantial impact upon each person's situation. You should contact your tax advisor concerning your particular situation. Every investor’s situation is unique and you should consider your investment goals, risk tolerance and time horizon before making any investment. Investing involves risk and you may incur a profit or loss regardless of strategy selected.

A Stock Market Conundrum

First Trust Monday Morning Outlook

Brian S. Wesbury - Chief Economist

Robert Stein, CFA - Dep. Chief Economist

January 29, 2024

The economy is still growing. Real GDP rose at a solid 3.3% annual rate in the fourth quarter, and consumer spending was strong in December meaning the first quarter is off to a good start. New home sales came in above expectations and initial jobless claims remain low, although orders for durable goods came in low due to weak demand for aircraft.

All eyes are now on Friday’s jobs report, which we expect to show a gain of about 170,000 while the unemployment rate holds steady. But the strength in employment seems fragile. If we exclude job gains in government, health & education (which are largely funded by government), and leisure & hospitality (still recovering from lockdowns), job growth looks exceptionally weak. In the last seven months of 2023, payrolls excluding those categories rose only 3,000 per month, the kind of weakness we might expect before a recession. In other words, much of recent growth is fueled by government deficits.

Meanwhile the stock market continues to rally, with the S&P 500 closing at a new record high last Thursday. That’s great, but we aren’t exactly sure what the market sees.

If the economy remains healthy and keeps growing, it’s very hard to imagine the Federal Reserve cutting short-term interest rates by the 125-150 basis points the markets appear to expect. In turn, less rate cutting than the market expects should be a headwind for equities in 2024.

What would get the Fed to cut rates by 125-150 bps? Either a sharp drop in inflation or a decline in economic growth. While lower inflation is good, can a sharp drop happen without a weak economy? Either way, we don’t think the stock market would like that outcome because they would likely signal lower corporate profits.

This is all consistent with our Capitalized Profits Model, which still says stocks are overvalued. That model uses economy-wide profits from the GDP accounts (excluding profits or losses by the Fed) and discounts them by the 10-year Treasury yield. Using the level of profits in the third quarter (we won’t get Q4 numbers for profits until the end of March) and a 10-year yield of 4% (which was its yield before rate cut expectations started to evaporate), suggests the S&P 500 would be fairly valued at about 3,900, well below recent highs.

What would it take to suggest that recent stock prices are appropriate? A 10-year yield of 3.2% would do it. So would a 30% increase in profits. But a 3.2% yield would probably be accompanied by lower profits and a 30% surge in profits would likely be accompanied by a much higher 10-year yield, so fair value is even further away than it seems.

The only way out of this conundrum is if Artificial Intelligence and other new and rapidly advancing technologies provide a miraculous boost to productivity. This could keep growth strong, or even accelerate it, while bringing inflation down. In other words, profits up and interest rates down.

While this could happen, it would take a miracle. And while expecting miracles worked for San Francisco fans, we still think investors should remain cautious. The monetary and fiscal stimulus that made COVID lockdowns seem like a bump in the economic road are wearing off.

The attached information was developed by First Trust, an independent third party. The opinions are of the listed authors at First Trust Advisors L.P, and are independent from and not necessarily those of RJFS or Raymond James.  All investments are subject to risk. There is no guarantee that these statements, opinions, or forecasts provided in the attached article will prove to be correct. Individual investor's results will vary. Past performance does not guarantee future results. Forward looking data is subject to change at any time and there is no assurance that projections will be realized. Any information provided is for informational purposes only and does not constitute a recommendation. Investing involves risk and you may incur a profit or loss regardless of strategy selected. The S&P 500 is an unmanaged index of 500 widely held stocks that is generally considered representative of the U.S. stock market.

Slower Growth in Q4, But No Recession

First Trust Monday Morning Outlook

Brian S. Wesbury - Chief Economist

Robert Stein, CFA - Dep. Chief Economist

January 22, 2024

The economy slowed substantially in the last quarter of 2023 from the rapid pace of the third quarter, but, as we explain below, still expanded at a moderate rate. Some will take this week’s Real GDP report to confirm their prior view the recession is simply not in the cards for the US economy, but we still think a recession is more likely than not.

Why do we still think a recession is coming? Because monetary policy is tight whether you like to use the yield curve, the “real” (inflation-adjusted) federal funds rate, or the M2 measure of money to assess the stance of policy from the Federal Reserve.

Why hasn’t a recession happened yet? Because monetary policy works with long and variable lags and a surge in the budget deficit in 2023 temporarily postponed the economic day of reckoning. We are right now living through a reckless Keynesian experiment with massive deficit spending relative to low unemployment, with the government having devised programs to temporarily boost GDP in the short run. But this government spending isn’t lifting long-term growth; it’s stealing from future growth.

In the meantime, higher short-term interest rates mean businesses have the ability to lock in healthy nominal returns on cash with minimal risk. In turn, this should lead to a reduction in risk-taking and business investment.

In the meantime, we estimate that Real GDP expanded at a moderate 2.1% annual rate in the fourth quarter, mostly accounted for by an increase in consumer spending.

Consumption: “Real” (inflation-adjusted) retail sales outside the auto sector rose at a modest 1.3% annual rate in Q4 while auto sales declined at a 3.6% rate. However, it looks like real services, which makes up most of consumer spending, should be up at a moderate 2.4% pace. Putting it all together, we estimate that real consumer spending on goods and services, combined, increased at a 2.2% rate, adding 1.5 points to the real GDP growth rate (2.2 times the consumption share of GDP, which is 68%, equals 1.5).

Business Investment: We estimate a 1.8% growth rate for business investment, with gains in intellectual property leading the way, while commercial construction declined. A 1.8% growth rate would add 0.2 points to real GDP growth. (1.8 times the 13% business investment share of GDP equals 0.2).

Home Building: Residential construction is showing some resilience in spite of some lingering pain from higher mortgage rates. Home building looks like it grew at a 2.6% rate, which would add 0.1 points to real GDP growth. (2.6 times the 4% residential construction share of GDP equals 0.1).

Government: Only direct government purchases of goods and services (not transfer payments) count when calculating GDP. We estimate these purchases – which represent a 17% share of GDP – were up at a 1.7% rate in Q4, which would add 0.3 points to the GDP growth rate (1.7 times the 17% government purchase share of GDP equals 0.3).

Trade: Looks like the trade deficit shrank in Q4, as both exports and imports declined but imports declined faster. In government accounting, a drop in the trade deficit means faster growth, even if exports and imports both declined. We’re projecting net exports will add 0.3 points to real GDP growth.

Inventories: Inventory accumulation looks like it slowed down in Q4, meaning inventories generally went up, but at a slower pace than in Q3. That translates into what we estimate will be a 0.3 point drag on the growth rate of real GDP. When a recession hits, we expect inventory declines to play a significant role in the drop in GDP.

Add it all up, and we get a 2.1% annual real GDP growth rate for the fourth quarter. If we are right about a recession, this number is likely to go to zero or below sometime in first half of 2024.

The attached information was developed by First Trust, an independent third party. The opinions are of the listed authors at First Trust Advisors L.P, and are independent from and not necessarily those of RJFS or Raymond James.  All investments are subject to risk. There is no guarantee that these statements, opinions, or forecasts provided in the attached article will prove to be correct. Individual investor's results will vary. Past performance does not guarantee future results. Forward looking data is subject to change at any time and there is no assurance that projections will be realized. Any information provided is for informational purposes only and does not constitute a recommendation. Investing involves risk and you may incur a profit or loss regardless of strategy selected.

Budgets And Governing

First Trust Monday Morning Outlook

Brian S. Wesbury - Chief Economist

Robert Stein, CFA - Dep. Chief Economist

January 16, 2024

The leaders of the House and Senate have come up with a new budget deal, and many people aren’t happy. It still needs passing by January 19th, or else the government, evidently, may shutdown. We doubt that this will happen, but the fight over government spending seems to drag on year after year after year.

It’s not hard to understand why. Non-defense spending by the federal government (including entitlements like Social Security) has climbed dramatically.

  • 10% of GDP in the 1960s

  • 14.8% of GDP in 2001

  • 15.2% of GDP in 2007

  • 17.8% of GDP in 2019

  • And now, projected at roughly 22% of GDP over the next 5 years, after peaking at 27.7% in 2020

In other words, non-defense spending now consumes more than twice as much GDP every year as it did 60 years ago. It’s share of GDP is up 45% from just before the Great Recession, and it’s up 24% from the year before COVID. Government continues to take more and more of what the private sector produces, and it is heading for annual deficits of about $2 trillion.

The Great Recession and COVID were one off-events. Yet somehow, government spending never returned to pre-crisis levels following either. And because politicians have not been punished at the ballots for such unconstrained spending – or the resulting deficits – they have had little incentive to alter course.

This is why budget battles have turned consistently ugly in recent years. Repeated threats to not raise the debt ceiling or shut down the government because a budget can’t be agreed on have become commonplace. An ever- changing mix of politicians who want to see spending controlled face heavy pressure from every direction that they must go along to get along. But they still fight. And fight they should.

Total debt has ballooned at the same time the Fed lifted artificially low interest rates to fight the inflation that poor policies created, causing net interest expenses to skyrocket. In 2020, the net interest expense was $332.6 billion. In the past twelve months, it has totaled $730.4 billion. The Congressional Budget Office expects net interest expenses to rise to above $1 trillion per year after 2028. Lunacy.

While many think all the US has to do is raise tax rates, history suggests eliminating deficits this way is virtually impossible. The last period the budget was balanced was between 1998 and 2001. During those years, tax receipts averaged an all-time record of 19.4% of GDP, while total spending averaged just 18%.

This was the tail end of a miraculous period in modern US history. Starting with Ronald Reagan, and continuing through Bill Clinton, government spending fell as a share of GDP. The less government spends, the more there is left for private sector growth. Economic growth boomed, and that growth boosted tax receipts.

When spending gets too high, economic growth slows, as do tax receipts. Last year, the CBO’s budget forecast overestimated tax receipts by 11%, and underestimated spending by 9%. The bigger government gets, the more likely this happens year after year.

Back in the 1980s and 1990s, when the US was cutting spending, real GDP grew an average of 3.2% per year. In the past two years, in spite of historically large Keynesian deficits, real GDP has averaged just 1.7%.

We understand that the make-up of Congress creates difficulties for those who want to cut spending. But calling them names and accusing them of not being able to govern perpetuates the problem. Out of control spending, and huge deficits as far as the eye can see, are the real failure in governance.

The attached information was developed by First Trust, an independent third party. The opinions are of the listed authors at First Trust Advisors L.P, and are independent from and not necessarily those of RJFS or Raymond James.  All investments are subject to risk. There is no guarantee that these statements, opinions, or forecasts provided in the attached article will prove to be correct. Individual investor's results will vary. Past performance does not guarantee future results. Forward looking data is subject to change at any time and there is no assurance that projections will be realized. Any information provided is for informational purposes only and does not constitute a recommendation. Investing involves risk and you may incur a profit or loss regardless of strategy selected.

Low Quality Growth

First Trust Monday Morning Outlook

Brian S. Wesbury - Chief Economist

Robert Stein, CFA - Dep. Chief Economist

January 8, 2024

Last Friday’s jobs report showed nonfarm payrolls up 216,000 in December, beating the consensus expected 175,000. Many are arguing that this was a huge number proving that the economy is not going into recession. But digging deeper into the data brings some doubt. In fact, it looks like the US is seeing low quality growth.

For example, yes, nonfarm payrolls came in better than expected in December, but not after adjusting for downward revisions of 71,000 to prior months. These downward revisions have now happened in ten out of the eleven past months. Over the past three months, private payrolls have increased a moderate 115,000 per month, tying for the slowest three-month pace of job gains since the COVID reopening started back in 2020.

What’s more, average hours worked by employees also fell by 0.2% in December. Despite more workers, we worked less in December than we did the month before, which is a headwind to growth. Losing 0.2% total hours of work is the equivalent to losing 228,000 jobs.

More importantly, the kind of jobs being added are of lower quality than we want. In 2023, nearly half of all jobs added were in the government and health care (which is heavily funded by government). Compare this to 2015 - 2019 (before COVID) when these two sectors accounted for a fifth of new jobs added.

Where else is the quality of growth low? Construction. Many people are talking about onshoring as manufacturing comes back to the US. Manufacturing facility construction is up 59.1% from a year ago and up 123.5% from two years ago. But this isn’t all private money. The government is funding many new projects, with the CHIPS Act and Inflation Reduction Act, artificially boosting spending in areas like manufacturing construction. But this deficit spending can’t last forever.

Real (inflation-adjusted) government purchases, which feed directly into the GDP numbers, are up 4.8% in the past year versus an average of 1.0% in the past twenty years. Meanwhile, recent government programs have been structured to multiply private-sector investment in politicallyfavored sectors, like “clean energy.” That, in turn, helped prop up economic performance last year – pushing out a recession that had looked likely to arrive at some point in 2023. But it’s low-quality growth that comes at a price. In order to spend on government favored projects, we must tax profitable entities in other areas. This redistribution does not add to growth, it just shifts it from one sector to another.

In fiscal year 2023, the U.S. government spent over $6.1 trillion dollars and ran a budget deficit of nearly $1.7 trillion dollars. That is fiscal madness. And it understates the true spending because the government was credited with a $333 billion “negative outlay” when the Supreme Court struck down President Biden’s plan to forgive student loans. Strip that out, and government spending in fiscal year 2023 represented roughly 24.0% of GDP. An incredibly high number for peacetime, especially for an economy that wasn’t in recession and had an unemployment rate below 4.0%.

It's only a matter of time before low quality growth stalls out. There are consequences to taking short term gains rather than fixing structural problems. Just ask California, Illinois, or New York.

In the meantime, the Federal Reserve is tasked with navigating treacherous terrain. Inflation is moderating but is still too high. The Fed’s choice to move from a scarce reserve system to a system of abundant reserves makes battling inflation that much tougher. And they are navigating with blinders on, willfully ignoring changes to the M2 money supply, down 3.0% in the past year.

We haven’t lost faith in the U.S. economy. Far from it. But we need to take an honest view on the sustainability of the current growth. For the sake of future progress, the government needs to stop digging the hole deeper and face issues head on. We will never beat China by trying to be like China. Government can never create wealth in the long run.

The attached information was developed by First Trust, an independent third party. The opinions are of the listed authors at First Trust Advisors L.P, and are independent from and not necessarily those of RJFS or Raymond James.  All investments are subject to risk. There is no guarantee that these statements, opinions, or forecasts provided in the attached article will prove to be correct. Individual investor's results will vary. Past performance does not guarantee future results. Forward looking data is subject to change at any time and there is no assurance that projections will be realized. Any information provided is for informational purposes only and does not constitute a recommendation. Investing involves risk and you may incur a profit or loss regardless of strategy selected.