

Budget Rule Shenanigans
First Trust Monday Morning Outlook
Brian S. Wesbury - Chief Economist
Robert Stein, CFA - Dep. Chief Economist
November 25, 2024
The Tax Cut and Jobs Act (TCJA) was passed in 2017, otherwise known as the Trump Tax Cuts. Because of arcane budget rules, the TCJA will “sunset” or expire at the end of 2025 in the absence of a brand-new tax law. The potentially expiring tax cuts include those on regular income as well as estates and qualified small businesses.
In turn, a key legislative problem throughout the process will be biased budget rules. You’d think that just keeping the tax code the same as it was this past year wouldn’t take any special political effort at all, but that’s not how it works.
Tax legislation must be “scored” by the Joint Committee on Taxation (JCT) and the Congressional Budget Office (CBO), in order to estimate the impact on revenues in future years. If the JCT and CBO compare current tax rates to the rates that existed before the TCJA, they call it a tax cut all over again. This scores as a cut in revenue (therefore a boost in the deficit from its current path), and 60 votes in the US Senate are necessary to make the new law permanent.
The other option is to find “pay fors” – offsetting tax hikes or spending cuts – that would “pay” for the tax cuts. If there aren’t 60 Senate votes or enough “offsets,” a tax cut can be made “temporary” as long as it fits inside other arcane rules. This is what happened in 2017. It’s why the TJCA expires in 2025.
So, the same issue will come up next year when the Trump Administration tries to extend the current tax rates. Senate rules say that if tax rates stay at the exact same level they are today, this will “cost” approximately $4 trillion in revenue over the next 10 years. Therefore, the Senate needs 60 votes to do this.
The problem is that the CBO and JCT were totally off on their forecasts of tax revenue back in 2018 when they scored the TCJA. In April 2018, the CBO said revenues would be $4.4 trillion in 2024. The were actually $4.9 trillion. Inflation, you say? OK…the CBO estimated that tax revenues would average 17% of GDP between 2021 and 2024, but they actually averaged 17.7% of GDP. To put this in further perspective, from 1974- 2023, the average federal tax share of GDP has been 17.3%.
In other words, the tax cuts did not lose anywhere near the revenue the CBO projected. Prior to the TCJA, the CBO said revenues would rise to 18.1% of GDP between 2021 and 2024. They estimated the TCJA would drop that to 17% of GDP, when in reality it averaged 17.7%. Why? Because government scores tax rate changes “statically.” But we all know the world is not static. Behavior changes when people face different incentives, and tax rates are a big one.
The biggest problem today is not tax revenues…it is spending. Back in 2018, the CBO forecasted that total public debt would be $22.9 trillion at the end of FY 2024. The actual figure was $28.3 trillion. Congress never has a problem spending more, and the rules are biased against tax cuts.
It is true that tax rates are “scheduled” to rise in 2026 and the CBO estimates this will raise revenue. But the CBO underestimated revenue after the TCJA. So, if Congress cannot find a way to say “extending current tax rates costs nothing,” the least it can do is admit that it underestimated the loss in revenue by 0.7% of GDP (17% vs 17.7%). That would mitigate more than 60% of the costs of extending the TCJA. Revenues did not fall from 18.1% of GDP to 17%...they were actually 17.7%.
Without moving to dynamic scoring, the government must pay for tax cuts with spending cuts or other tax hikes. In the past, Congress has scored potential savings from new rules in its budget, so why not score DOGE (the Musk-Ramaswamy enterprise) as cutting spending, even if it will come at some later date? Who actually thinks they won’t be somewhat successful?
The most frustrating part of all this is that if a new Administration and Congressional majorities wanted to raise taxes rather than reduce taxes the same burdensome legislative hurdles would not apply. A bill to raise taxes would be assessed using static scoring – no slower economic growth – and would show revenue going up, and then be allowed as a permanent change to the tax code, with no need for periodic temporary extension bills like tax cutters will have to pass next year. That is totally unfair!

The attached information was developed by First Trust, an independent third party. The opinions are of the listed authors at First Trust Advisors L.P, and are independent from and not necessarily those of RJFS or Raymond James. All investments are subject to risk. There is no guarantee that these statements, opinions, or forecasts provided in the attached article will prove to be correct. Individual investor's results will vary. Past performance does not guarantee future results. Forward looking data is subject to change at any time and there is no assurance that projections will be realized. Any information provided is for informational purposes only and does not constitute a recommendation. Investing involves risk and you may incur a profit or loss regardless of strategy selected.
Don’t Forget the Lags
First Trust Monday Morning Outlook
Brian S. Wesbury - Chief Economist
Robert Stein, CFA - Dep. Chief Economist
November 18, 2024
In our lifetimes, the best comparison for Trump’s election win is Ronald Reagan’s in 1980. That election, like this one, pitted big spenders and champions of government against tax cutters and critics of government.
It is pretty clear that markets approved of both winning campaigns as they were happening. Leading up to the election in 1980, like this year, the S&P 500 rallied as it became clearer that Reagan (like Trump) was likely to win. The market also rallied in the days following the election because markets like tax cuts, deregulation, and restrained government. And, at the same time, the policies the markets didn’t like – such as a tax on unrealized capital gains – were now dead.
But after being euphoric at the outcome of the election in 1980, reality set in. Paul Volcker was fighting inflation with tight money, a recession was inevitable and tax cuts took time to pass. The S&P 500 fell in 1981 and in the first eight months of 1982 before the Reagan bull market really started.
History doesn’t repeat itself, but at times it rhymes. And while there are similarities between today and 1981, there are also some key differences. For example, the Federal Reserve is now cutting interest rates, not raising them. However, there are some big differences that investors need to pay attention to. First, in October 1980, the Price-Earnings ratio of the S&P 500 was 8.6. In October 2024, the PE ratio was 27. In other words, while the market may appreciate better policies, it sure looks like they are already priced in.
Moreover, while Trump is selecting his cabinet rapidly and his team has likely already done the homework needed to move fast on executive orders that can boost growth, much of the real work will take time. It appears Congress wants to move fast, but it is still Congress and that means it’s messy.
Reagan cut tax rates across the board, Trump plans to maintain most current tax rates with some small changes, and promised to eliminate taxes on tips, social security, and overtime. These tax cuts are welcome, but they are not true supply-side tax cuts…the ones that boost entrepreneurship and innovation.
The really powerful potential of the Trump plans will come from DOGE, the Department of Government Efficiency, where Musk and Ramaswamy plan on proposing big cuts to the fourth branch of government – the Bureaucrats. Every regulation that they can cut, every bureaucrat that they can keep from gumming up the private sector, will boost productivity.
But in addition to cutting red tape, the US must cut the absolute size of government. John Maynard Keynes wanted deficit spending ended after a crisis was over. But, after both the Panic of 2008 and COVID, the US kept spending elevated. Government spending has risen from 19.1% of GDP in 2007 to 23.4% this year. Government is a ball and chain on the economy. We estimate that every one percentage point increase of spending as a share of GDP reduces underlying real GDP growth by 0.2%.
Every dollar the government spends is taken from the private sector, and the government taxes and borrows nearly 5% more of GDP today than it did seventeen years ago. From 1990 through 2007, real GDP grew 3% per year. From 2008 through the second quarter of 2024, real GDP has only grown 2% per year. No wonder “the economy” was the #1 factor for Americans in this election. Two percent annual growth is stagnation.
And this shouldn’t be happening according to fans of big government. Economists like Mark Zandi and Paul Krugman support government spending and argue that it has a positive multiplier ($1 of government spending creates more than $1 of GDP). Add this to the fact that the US has invented unbelievably productive new technologies in the last 17 years, and the economy should be booming. Especially with the Fed holding rates at zero for nine of those years.
But it hasn’t, and the reason is that government is just too darn big. Cutting government spending is a double-edged sword. Half of all job growth in the past year has been in government jobs directly, as well as healthcare which is dominated by government. Taking away that spending will initially slow job growth, but, with a lag, eventually boost economic activity.
In other words, the Trump Administration has a chance to boost underlying economic growth rates, and that would be extremely positive for living standards and equity values over the long-term. But initially, it may result in slower growth. The US had a car wreck with COVID. Easy money from the Fed and big deficits were like morphine. The US is addicted to short-term fixes that do nothing to boost long-term growth. Withdrawal from the pain killers hurts, but is necessary to get truly healthy.
While we are extremely positive about the long-term benefits of policy changes, like under Reagan, weaning the US from massively easy fiscal policies does not guarantee overnight success. It will take time, and the US will come through to the other side stronger. The entire world will benefit…with a lag.
The attached information was developed by First Trust, an independent third party. The opinions are of the listed authors at First Trust Advisors L.P, and are independent from and not necessarily those of RJFS or Raymond James. All investments are subject to risk. There is no guarantee that these statements, opinions, or forecasts provided in the attached article will prove to be correct. Individual investor's results will vary. Past performance does not guarantee future results. Forward looking data is subject to change at any time and there is no assurance that projections will be realized. Any information provided is for informational purposes only and does not constitute a recommendation. Investing involves risk and you may incur a profit or loss regardless of strategy selected.
The Fed's Challenge
First Trust Monday Morning Outlook
Brian S. Wesbury - Chief Economist
Robert Stein, CFA - Dep. Chief Economist
November 11, 2024
The Federal Reserve cut short-term rates by a quarter percentage point last week, like pretty much everyone expected. In addition, the Fed didn’t push back hard against market expectations of another quarter-point cut in mid-December, so unless the economic or financial news changes dramatically by then, expect a repeat at the next meeting.
It's not hard to see why the Fed has been cutting rates. The consumer price index is up 2.4% in the past year versus a 3.7% gain in the year-ending in September 2023. Meanwhile, the PCE deflator, which the Fed uses for its official 2.0% inflation target, is only up 2.1% in the past year while it was up 3.4% in the year ending in September 2023.
However, in spite of getting into the Red Zone versus inflation, the Fed isn’t yet in the End Zone, and it looks like progress has recently stalled. According to the Atlanta Fed, the CPI is projected to be up 2.7% in the year ending this November while PCE prices should be up 2.5%.
It's also important to recognize that a few years ago the Fed itself devised a measure it called Supercore inflation, which excludes food, energy, all other goods, and housing. That measure of prices is still up 4.3% versus a year ago, which is probably why the Fed has stopped talking about it.
Moreover, it’s important to recognize that there’s a huge gulf between the policy implications of the Fed reaching its 2.0% inflation goal and the public’s perception of inflation no longer being a problem. Right or wrong, for now, the public seems to think that for inflation to no longer be a problem prices would have to go back down to where they were pre-COVID.
But that’s not going to happen. The federal government spent like drunken sailors during COVID and the Fed helped accommodate that spending by allowing the M2 measure of the money supply to soar. M2 is off the peak it hit in early 2022, but it would take a much greater reduction than so far experienced to restore prices as they were almost five years ago.
Instead, getting to 2.0% inflation means eventually accepting not only that prices aren’t going back to where they were but they’re going to keep rising, albeit at a slower pace.
And remember, even that goal has so far remained elusive. The embers of inflation continue burning. And since we have yet to see a significant or prolonged slowdown in growth, much less a recession, it remains to be seen whether inflation will reach 2.0% or less on a consistent basis. The bottom line is that the Fed’s inflation goal remains elusive. In turn, that means don’t be surprised if the Fed pauses rate cuts early next year.

The attached information was developed by First Trust, an independent third party. The opinions are of the listed authors at First Trust Advisors L.P, and are independent from and not necessarily those of RJFS or Raymond James. All investments are subject to risk. There is no guarantee that these statements, opinions, or forecasts provided in the attached article will prove to be correct. Individual investor's results will vary. Past performance does not guarantee future results. Forward looking data is subject to change at any time and there is no assurance that projections will be realized. Any information provided is for informational purposes only and does not constitute a recommendation. Investing involves risk and you may incur a profit or loss regardless of strategy selected.
Late Tech Losses Sink October Equity Market Gains

Raymond James
Markets & Investing
October 31, 2024
The S&P 500 narrowly misses a sixth consecutive month with positive performance.
Better than expected economic data drove interest rates higher, changing the market narrative and contributing to an equity market pullback early in the month. This unraveled expectations of further rate cuts by the Federal Reserve (Fed) and resulted in real rates moving higher. The 10-year Treasury has moved up 48 basis points, ending the month at 4.27%.
It appeared as though the equity indexes were bound to overcome that early pullback, but an end-of-month slide proved to be enough to push the S&P 500 (-0.6%), Dow Jones (-1%) and Nasdaq (-0.1%) into slightly negative territory for the month. The broadening trend we saw last quarter appears to have ended with the slightly higher rates and election uncertainty creeping into the market. Communications services and financials were the best-performing sectors.
The S&P 500 is on track to deliver its second consecutive year of 20+% returns – a milestone it has not achieved since 1998 when the U.S. economy simultaneously experienced a soft landing and a tech revolution. The S&P 500 is also on pace to deliver its strongest performance leading into an election year since 1932.
“After five consecutive positive months, October missed being the sixth by just a few hours when it gave back gains due to tech losses on the 31st,” says Raymond James Chief Investment Officer Larry Adam. “Overly optimistic sentiment and potential volatility surrounding the election leads us to be cautious in the near term.”
We’ll get into more detail shortly, but first, a look at the numbers year-to-date:

*Performance reflects index values as of market close on October 31, 2024. Bloomberg Aggregate Bond and MSCI EAFE reflect October 30, 2024, closing values.
Key indices point to growth
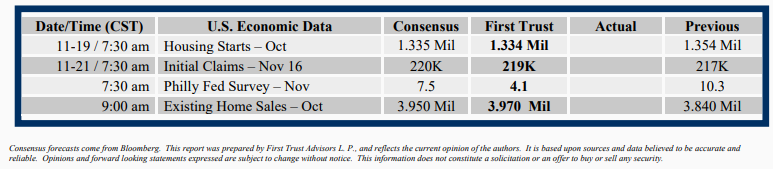
The ISM Manufacturing Index revealed contraction in industrial production, which could lead to less upward pressure on the price of inputs, something that is consistent with disinflationary predictions. The ISM Services Index, however, showed considerable growth, laying to rest any fears surrounding an economic slowdown. Strong employment growth, which pushed the unemployment rate back to 4.1%, reinforced our belief that the US will achieve the Fed’s soft landing target amid rate cuts.
Overall housing starts were weak in September largely because of multifamily units, but single-family units were strong in key regions like the Northeast. A significant risk of lowering interest rates is for home prices to increase further, as lower borrowing costs attract more buyers, and contribute further to the affordability crisis.
A close presidential race brings uncertainty
With the 2024 U.S. presidential race just days away, polls are still showing a dead heat between the candidates. The race remains too close to predict, and the outcome will likely come down to votes in a handful of swing states given the electoral college’s winner-take-all system. With each of the two main candidates favoring radically different policy, the outcome could have a lasting impact on economic factors worldwide.
In other news, the Department of Justice’s antitrust case against Google is unlikely to result in a breakup, and nuclear energy has risen to the forefront of the conversation surrounding the colossal energy needs of artificial intelligence as it scales up in the coming years.
S&P 500 continues to break records
October brought about new all-time highs for the S&P 500, which closed at 5,864.67 on October 18. So far, Fed activities have contributed their expected boost to economic growth, with the possibility of inflation sneaking back in as a result of cutting interest rates still on the table, combined with potential tariffs to reenforce the push and pull dynamic of economic outcomes. Outlook on equities remains positive over the next year, but uncertainty and volatility on key macroeconomic drivers could create headwinds.
Yields go up across the board
Treasury yields took a sharp upward turn over the course of the past month, up 40 to 65 basis points from 2 years out to 30 years. The market is anticipating another 25 basis point cut from the Fed during its upcoming November meeting. Corporate and municipal bond yields have increased alongside those from the Treasury, with the most attractive part of the curve in the municipal space in longer maturities. Muni-Treasury ratios remain mostly unchanged since last month.
Oil market grows numb to Middle East geopolitics
Following the threat of all-out war between Israel and Iran, both sides eventually deescalated, cooling off oil prices that had briefly spiked. More than a year after Israel’s war with Hamas began, the oil market seems to have desensitized to conflicts in the region. Day-to-day volatility has refocused back to classic supply-and-demand factors. Mixed messages from OPEC+ suggest the group’s long period of production discipline may be coming to an end, with Saudi Arabia refocusing on market share rather than propping up oil prices. That and China’s quick adoption of EVs could lead to a less than bullish sentiment surrounding oil.
Global macros impact financial markets
October has taught us not to discount worldwide economic trends when it comes to individual financial markets, with three major developments having had widespread influence. First, the Bank of China has foreshadowed a loosening of monetary policy in an effort to meet the growing demands for their slowing economy. However, concerns that it may not be enough for the long term have been raised. Historically, China’s substantial economic growth has been attributed mainly to investment and export activity, and although short-term solutions have worked in the past, their pace may not be sustainable unless a major policy shift is implemented.
Second, the ongoing conflicts in the Middle East remain a source of uncertainty for commodities and equities alike. The worst-case scenario of all-out war between Israel and Iran has been averted for the time being, though the risk of escalation remains elevated as Israel continues its military action in Gaza and Lebanon.
Finally, incoming economic data has led to policy response from central banks. In Canada, interest rate cuts are expected as inflation targets are reached throughout the coming months. European data shows the Consumer Price Index dropped to just 1.7% growth year-over-year in September, and with business stagnation a pressing issue, rate cuts are likely in that arena as well. In Japan, political issues have weakened the Yen, but seemingly helped the country’s highly volatile stock market. The Bank of Japan is favoring steady monetary conditions until the political backdrop becomes clearer.
The bottom line
With all eyes on the upcoming U.S. presidential election as well as uncertainty stemming from conflicts in the Middle East, the broader economic landscape could shift in the coming months. But certain trends remain steady, and markets are continuing to react positively to rate cuts and favorable inflation numbers.
Investing involves risk, and investors may incur a profit or a loss. All expressions of opinion reflect the judgment of the Raymond James Chief Investment Officer and are subject to change. There is no assurance the trends mentioned will continue or that the forecasts discussed will be realized. Past performance may not be indicative of future results. Economic and market conditions are subject to change. Diversification does not guarantee a profit nor protect against loss. The Dow Jones Industrial Average is an unmanaged index of 30 widely held stocks. The NASDAQ Composite Index is an unmanaged index of all common stocks listed on the NASDAQ National Stock Market. The S&P 500 is an unmanaged index of 500 widely held stocks. The MSCI EAFE (Europe, Australasia and Far East) index is an unmanaged index that is generally considered representative of the international stock market. The Russell 2000 is an unmanaged index of small-cap securities. The Bloomberg Barclays US Aggregate Bond Index is a broad-based flagship benchmark that measures the investment grade, U.S. dollar-denominated, fixed-rate taxable bond market. An investment cannot be made in these indexes. The performance mentioned does not include fees and charges, which would reduce an investor’s returns. Companies engaged in business related to a specific sector are subject to fierce competition and their products and services may be subject to rapid obsolescence. There are additional risks associated with investing in an individual sector, including limited diversification. A credit rating of a security is not a recommendation to buy, sell or hold the security and may be subject to review, revision, suspension, reduction or withdrawal at any time by the assigning Rating Agency. Bond prices and yields are subject to change based upon market conditions and availability. If bonds are sold prior to maturity, you may receive more or less than your initial investment. Income from municipal bonds is not subject to federal income taxation; however, it may be subject to state and local taxes and, for certain investors, to the alternative minimum tax. Income from taxable municipal bonds is subject to federal income taxation, and it may be subject to state and local taxes. Investing in commodities is generally considered speculative because of the significant potential for investment loss. Their markets are likely to be volatile and there may be sharp price fluctuations even during periods when prices overall are rising. International investing involves special risks, including currency fluctuations, differing financial accounting standards, and possible political and economic volatility. The Consumer Price Index is a measure of inflation compiled by the US Bureau of Labor Studies. The Leading Economic Index (LEI) provides an early indication of significant turning points in the business cycle and where the economy is heading in the near term. This is not a recommendation to purchase or sell the stocks of the companies pictured/mentioned. Investing in small-cap stocks generally involves greater risks, and therefore, may not be appropriate for every investor. The prices of small company stocks may be subject to more volatility than those of large company stocks. The Nikkei 225 is a stock market index is for the Tokyo Stock Exchange (TSE). It is the most widely quoted average of Japanese equities. Sector investments are companies engaged in business related to a specific sector. They are subject to fierce competition and their products and services may be subject to rapid obsolescence. There are additional risks associated with investing in an individual sector, including limited diversification.
Material created by Raymond James for use by its advisors.
Markets are Smarter than Government
First Trust Monday Morning Outlook
Brian S. Wesbury - Chief Economist
Robert Stein, CFA - Dep. Chief Economist
October 28, 2024
To paraphrase Milton Friedman: There are four ways in which you can spend money. You can spend your own money on yourself. You can spend your own money on somebody else. You can spend somebody else’s money on yourself. Finally, you can spend somebody else’s money on somebody else.
Spending your own money (whether on yourself or on someone else) means you will care about it. But, when you spend somebody else’s money, especially on somebody else, you don’t care how much you spend or what you get for it.
We were reminded of this recently when reading the news. Google and Amazon inked what are likely multiple-billion-dollar deals with power companies to build small scale, modular nuclear reactors. At the same time, Microsoft has agreed to pay for the revival of the shuttered Three Mile Island nuclear power plant in Pennsylvania.
Why? Because they want to power their own insatiable needs for electricity that will come from data centers to support generative Artificial Intelligence (AI). Solar and Wind won’t get the job done because they are intermittent power sources. To efficiently run an AI data center they need non-stop, reliable, 24/7 electricity. For green energy, that’s nuclear!
What’s so amazing about this is that the Green New Deal movement shunned nuclear power. California, Michigan, and Germany have all closed nuclear plants in a single-minded mission to only use solar and wind. We assume they believe using natural things, like sunlight and wind is better than using man-made things, like nuclear energy. Otherwise, these decisions make no sense.
But isn’t that what spending other people’s money is all about? You don’t have to care about how it is spent. And boy did they spend.
In the past 20 years, governments around the world have spent or have incentivized companies to spend $18.8 trillion dollars on green energy and just 1.4% of that was on nuclear. Last year alone, the total was $3.5 trillion, with less than 1% going toward nuclear. As we said, many governments have shut down nuclear power plants.
Interestingly, over 40% of this spending was based on what the movement calls “sustainable debt issuance,” which includes government subsidized loans. We have always believed much of this investment would not have been made without government subsidies, including the Federal Reserve holding interest rates below the rate of inflation for 80% of the time during the past fifteen years, with nine of those years at near 0% interest rates.
Unfortunately, it isn’t sustainable…while few focus on this, this area of the debt markets is likely to have problems in the future. How do we know? Because when it comes to spending their own money, Google, Amazon, and Microsoft aren’t relying on the politically-favored flavors of energy.
They are buying electricity provided by nuclear power. When you have to spend your own money, you go with what works, not what is politically palatable with the greens. Let’s go back to markets…that’s actually the only sustainable course.

The attached information was developed by First Trust, an independent third party. The opinions are of the listed authors at First Trust Advisors L.P, and are independent from and not necessarily those of RJFS or Raymond James. All investments are subject to risk. There is no guarantee that these statements, opinions, or forecasts provided in the attached article will prove to be correct. Individual investor's results will vary. Past performance does not guarantee future results. Forward looking data is subject to change at any time and there is no assurance that projections will be realized. Any information provided is for informational purposes only and does not constitute a recommendation. Investing involves risk and you may incur a profit or loss regardless of strategy selected.
Inflation Simplified
First Trust Economics
Three on Thursday
Brian S. Wesbury - Chief Economics
October 24, 2024
Milton Friedman famously stated, “Inflation is always and everywhere a monetary phenomenon, in the sense that it is and can only be caused by a more rapid increase in the quantity of money than in output.” Contrary to popular belief, inflation doesn’t stem from rising wages, greedy businesses, government deficits, or even rapid economic growth—it results from the excessive printing of money. In this week’s “Three on Thursday,” we break down inflation in the simplest terms. This is especially relevant today, as many people attribute the significant inflation of recent years solely to massive government spending or supply chain disruptions. However, these factors alone weren’t the root cause. For a deeper dive, explore the three graphics below.

Imagine a simple economy with only $10 and 10 apples. Since there are no other goods, each apple costs $1. Now, suppose the federal government wants to spend $2. The government typically spends money by either taxing or borrowing from the people who hold those dollars. So, let’s say they decide to tax $2 from the rich apple growers and give the $2 to others. After this, there are still $10 circulating in the economy—$2 that government redistributed and $8 with the other holders. Nothing fundamental changes: the total money in the economy remains $10, and there are still 10 apples, so each apple still costs $1. This illustrates why government spending, in itself, does not directly cause inflation. The money supply hasn’t increased; it’s just been redistributed.

Inflation occurs when the money supply grows faster than the amount of goods and services available. Let’s consider a scenario where the Federal Reserve increases the money supply by 30%, from $10 to $13. What happens next? If the production of apples doesn’t increase by the same 30%, and remains constant at 10 apples, each apple will now cost $1.30 instead of $1. This is because there’s more money in the system, but the number of goods (in this case, apples) hasn’t changed, leading to more money chasing the same amount of goods— inflation! Looking at what happened in 2020 and 2021, the money supply in the U.S. grew by 40% in less than two years! However, production didn’t increase nearly as much. As a result, there was significantly more money in circulation chasing only a slightly larger number of goods, causing the inflation we experienced.

Let’s enhance the scenario by considering the impact of government regulation. Initially, we planned to produce 10 apples, but the EPA says the herbicide we use is bad for the spotted-bluejay, so we can’t use it, and only 5 apples can be produced. This means that while the money supply has increased by 30%, production has dropped by 50%. As a result, the price of each apple rises to $2.60. We eventually invent a new herbicide after immense expense allowing production to return to 10 apples. However, even then, the price will remain elevated at $1.30 due to the earlier inflation. It’s only when production increases to 13 apples that prices can return to the original $1 per apple.
The attached information was developed by First Trust, an independent third party. The opinions are of the listed authors at First Trust Advisors L.P, and are independent from and not necessarily those of RJFS or Raymond James. All investments are subject to risk. There is no guarantee that these statements, opinions, or forecasts provided in the attached article will prove to be correct. Individual investor's results will vary. Past performance does not guarantee future results. Forward looking data is subject to change at any time and there is no assurance that projections will be realized. Any information provided is for informational purposes only and does not constitute a recommendation. Investing involves risk and you may incur a profit or loss regardless of strategy selected.
GDP Growth Still Solid
First Trust Monday Morning Outlook
Brian S. Wesbury - Chief Economist
Robert Stein, CFA - Dep. Chief Economist
October 21, 2024
With third quarter GDP being reported next Wednesday – less than a week before election day – the US is still not in recession.
Yes, monetary policy has been tight, but the lags between tighter money and the economy are long and variable. In addition, massive budget deficits continue to provide incomes for a wide range of occupations. The official figures for Fiscal Year 2024 arrived Friday afternoon (isn’t it just like the government to announce bad news right before the weekend!) and the deficit was $1.832 trillion, or what we estimate to be 6.4% of GDP. That’s the second straight year with a deficit in excess of 6.0% of GDP, in spite of an unemployment rate averaging less than 4.0%. These deficits, which are unprecedented in size given peacetime and low unemployment, may have temporarily masked the effects of tighter money.
Meanwhile, innovators and entrepreneurs in high-tech industries and elsewhere have been overcoming government obstacles to push the economy forward. It’s hard to tell how much each factor (government spending or innovation) deserves credit for recent GDP growth, but roughly half of job creation in the past year has been in government and healthcare.
In the meantime, we estimate that Real GDP expanded at a 3.0% annual rate in the third quarter, mostly accounted for by growth in consumer spending. (This estimate is not yet set in stone; reports on Friday about durable goods and next Tuesday about international trade and inventories might lead to an adjustment.)
Consumption: In spite of tepid auto sales, overall consumer spending continues to rise, possibly because of continued government deficits. We estimate that real consumer spending on goods and services, combined, increased at a 3.5% rate, adding 2.4 points to the real GDP growth rate (3.5 times the consumption share of GDP, which is 68%, equals 2.4).
Business Investment: We estimate a 1.7% growth rate for business investment, with gains in intellectual property leading the way, while commercial construction declined slightly. A 1.7% growth rate would add 0.2 points to real GDP growth. (1.7 times the 14% business investment share of GDP equals 0.2).
Home Building: Residential construction dropped in the third quarter, hampered by the lingering pain from higher mortgage rates as well as local obstacles to construction. Home building looks like it contracted at a 5.0% rate, which would subtract 0.2 points from real GDP growth. (-5.0 times the 4% residential construction share of GDP equals -0.2).
Government: Only direct government purchases of goods and services (not transfer payments) count when calculating GDP. We estimate these purchases were up at a 1.8% rate in Q3, which would add 0.3 points to the GDP growth rate (1.8 times the 17% government purchase share of GDP equals 0.3).
Trade: Looks like the trade deficit shrank slightly in Q3, as exports and imports both grew but exports grew faster. We’re projecting net exports will add 0.2 points to real GDP growth.
Inventories: Inventory accumulation looks like it was slightly faster in Q3 than Q2, translating into what we estimate will be a 0.1 point addition to the growth rate of real GDP.
Add it all up, and we get a 3.0% annual real GDP growth rate for the third quarter. Not a recession yet, but that doesn’t mean that the US economy is out of the woods.

The attached information was developed by First Trust, an independent third party. The opinions are of the listed authors at First Trust Advisors L.P, and are independent from and not necessarily those of RJFS or Raymond James. All investments are subject to risk. There is no guarantee that these statements, opinions, or forecasts provided in the attached article will prove to be correct. Individual investor's results will vary. Past performance does not guarantee future results. Forward looking data is subject to change at any time and there is no assurance that projections will be realized. Any information provided is for informational purposes only and does not constitute a recommendation. Investing involves risk and you may incur a profit or loss regardless of strategy selected.
Have We Reached Peak Keynesianism?
First Trust Monday Morning Outlook
Brian S. Wesbury - Chief Economist
Robert Stein, CFA - Dep. Chief Economist
October 14, 2024
There are two types of economists in the world…demand-siders and supply-siders. Without digging too deeply, one huge difference shows up in government policy. Supply-siders want low tax rates, high savings rates (and investment), and minimal regulation. Why? Because wealth and higher living standards come from entrepreneurship and invention – i.e. Supply.
Demand-siders think the way to boost growth is to boost “Demand.” John Maynard Keynes is the father of modern demand-side thought, arguing that if the pace of economic growth is too slow the government can step in to “stimulate demand” by running or expanding a government deficit.
A tenet of Keynesianism is that growth is best achieved by taxing money from those with higher incomes because they have a “higher propensity to save,” and giving it to those with lower incomes because they have a “higher propensity to consume.”
No wonder politicians love Keynes. It’s an economic theory that sanctions giving taxpayer resources directly to people under the theory that this will boost overall economic growth. At least in the short run according to the Keynesians – less economic growth and fewer jobs are worse than deficits. (And the long run doesn’t matter, they say, because we’ll all be dead, anyhow.)
The policy response to both the Financial Crisis and COVID was Keynesianism on steroids. Clearly, politicians of both parties have rallied behind the Keynesian flag in the past 16 years. As Richard Nixon once said,“We are all Keynesians now.”
Nixon may have been right if we apply that statement to politicians. But Friedman, Hazlitt, Mises, Hayek, and others continually pointed out the damage from this short-term, demand-side thinking would be immense and the stagflation of the 1970s proved them right and the politicians wrong. Like then, we think we have reached “peak Keynesianism” again!
The fiscal well is now running dry. The federal budget deficit was 6.2% of GDP in Fiscal Year 2023 and came in about 6.4% of GDP in FY 2024, which ended two weeks ago. To put this in perspective, the US did not run a budget deficit of more than 6.0% of GDP for any year from 1947 until the Great Recession and Financial Panic of 2008-09. Not during the Korean War, not during the Vietnam War, not during the Cold War. But now we did it two years in a row without a war and with the unemployment rate averaging 3.8%.
These deficits were made possible, in a large way, by having the Federal Reserve monetize the debt. At the same time the Fed held interest rates artificially low, meaning the actual cost of these deficits was masked. But, like the 1970s, inflation appeared due to easy money and now interest rates are up. The interest on the national debt has soared from a modest 1.5% of GDP in FY 2021 to what is likely 3.0% of GDP in FY 2024.
This means that if we hit a recession anytime soon, policymakers will find it very hard to rely on a Keynesian response. Deficits and interest payments are already too high!
At the same time, a Keynesian-motivated redistribution scheme to try to boost spending also faces a major hurdle. The personal saving rate – the share of after-tax personal income that is not consumed – was 4.8% in August. That’s well below the 7.3% average in 2019, prior to COVID, and less than half the savings rate of 12% that the US had in 1965. What this means is that trying to boost consumer spending by taking from Penelope to pay Paul will probably not work, either.
Put it all together and it looks like the traditional tools Keynesians like to use when economic troubles hit will not be available if the US runs into economic trouble. We see it everywhere. Evidently, the Secret Service, FEMA, and border security all need more money.
The system has reached Peak Keynesianism. Like the late 1970s and early 1980s, it is time to change course. The good news is that because of democracy, this can happen any time.

The attached information was developed by First Trust, an independent third party. The opinions are of the listed authors at First Trust Advisors L.P, and are independent from and not necessarily those of RJFS or Raymond James. All investments are subject to risk. There is no guarantee that these statements, opinions, or forecasts provided in the attached article will prove to be correct. Individual investor's results will vary. Past performance does not guarantee future results. Forward looking data is subject to change at any time and there is no assurance that projections will be realized. Any information provided is for informational purposes only and does not constitute a recommendation. Investing involves risk and you may incur a profit or loss regardless of strategy selected.
The Politics of Limits
First Trust Monday Morning Outlook
Brian S. Wesbury - Chief Economist
Robert Stein, CFA - Dep. Chief Economist
October 7, 2024
The federal debt is already $35 trillion and currently rising by roughly $2 trillion every year – with no end in sight. As a result, some investors are worried that the US could become a 21st Century version of Argentina: completely bankrupt and unable to pay the bills.
We don’t think that’s going to happen. It’s not that the national debt doesn’t matter, it does matter. Instead, it’s because the recent surge in the interest on the national debt is going to have big effects on government policy.
The best way to measure the manageability of the national debt is not the top-line debt number, $35 trillion in the case of the US. Instead, it’s the net interest cost of that debt relative to GDP. Think about it like a national mortgage payment relative to national income.
Back in the 1980s and 1990s the US was regularly paying Treasury bondholders roughly 3.0% of GDP. From Fiscal Year 1982 through 1998, the interest cost on the debt relative to GDP hovered between 2.5% and 3.2%. At this level, even politicians felt the pain. Both parties enacted policies that led to budget surpluses and interest costs relative to GDP plummeted. Between FY 2002 and 2022 the interest burden averaged roughly 1.5% of GDP and stayed between 1.2% and 1.9% of GDP.
We call this period the “Age of Candy.” What happened during the Age of Candy? We cut taxes in 2001, 2003, and 2017. In 2004 the US added a prescription drug benefit to Medicare. In 2010, with Obamacare, we enacted the first major expansion of entitlements since the 1960s – not by coincidence, another period when the interest burden on the debt was low.
Why did all this happen? We are sure others can come up with plenty of ideas, too. But we think a large factor is that when the interest burden of the debt was low (which meant they didn’t have to pay bondholders as much) politicians realized they had a lot of extra money sitting around to buy our votes. And that’s exactly what they did.
But the Age of Candy is finally coming to an end. In FY 2023 the interest burden hit 2.4% of GDP, the highest since 1999. And in FY 2024, which ended exactly one week ago, the interest burden is on track to hit 3.0% of GDP, the highest since 1996.
In the twelve months ending in March 2021, net interest totaled $315 billion. In the past twelve months it’s totaled $872 billion. That’s an increase of 177% in less than four years.
A big part of the problem is that the Federal Reserve was holding interest rates artificially low. The Treasury Department could have issued long-dated debt to lock in lower interest rates for longer. But like homebuyers between 2004-2007, they borrowed at short-term rates, which were even lower and that meant more room in the budget to spend, spend, spend.
High inflation finally forced the Fed to raise interest rates back to normal levels. Unfortunately, this inflation only represents part of the problem. The bigger long-term problem is that by holding rates artificially low, the Fed fooled politicians into believing the cost of deficits was minimal. Hopefully, America will look back on this period and realize that Fed policy and all that spending was a mistake.
Ultimately, however, we think the spike in the amount that the government has to pay bondholders will lead to more focus on controlling the budget deficit in the years ahead. Unlike the homebuyers who defaulted on their mortgages in the Great Financial Crisis, government can buy itself time. During the period from 1982-1998, the Politics of Limits took place.
Think about what lawmakers did during that timeframe. In 1982, there was a bipartisan deal to raise the payroll tax. In the mid-1980s we had a bipartisan trio of Senators (GrammRudman-Hollings) push legislation to try to control the growth of spending. In 1990 George Bush the Elder cut a deal with the Democrats to violate his “no new taxes” campaign pledge, raise taxes, and set spending caps on military and social spending. Then Bill Clinton and Congress raised taxes even more, kept the Bush-era spending caps in place, and reformed Medicare and welfare to reduce spending.
That was the Politics of Limits. Don’t be surprised if by 2026 the bond market vigilantes have their machetes fully sharpened and once again bring politicians to heel. The Age of Candy is coming to an end. Will politicians react the same way in the years ahead? We hope so, because if they don’t inflation will not go away and investor fears may be warranted.

The attached information was developed by First Trust, an independent third party. The opinions are of the listed authors at First Trust Advisors L.P, and are independent from and not necessarily those of RJFS or Raymond James. All investments are subject to risk. There is no guarantee that these statements, opinions, or forecasts provided in the attached article will prove to be correct. Individual investor's results will vary. Past performance does not guarantee future results. Forward looking data is subject to change at any time and there is no assurance that projections will be realized. Any information provided is for informational purposes only and does not constitute a recommendation. Investing involves risk and you may incur a profit or loss regardless of strategy selected.
Federal Reserve Rate Cut Helped Propel Markets Forward

Raymond James
Markets & Investing
September 30, 2024
The S&P 500 notched its first positive performance in a September since 2019.
September is typically the weakest month of the year for stocks, but thanks to the much-anticipated federal funds rate cut, the S&P 500 turned in its first positive performance in a September since 2019, achieving its 43rd record high of the year.
“The Federal Reserve [Fed] is recalibrating policy, and we are likely to see a series of rate cuts over the coming months as it gets closer to neutral, which is ultimately market friendly,” Raymond James Chief Investment Officer Larry Adam said.
The Fed took an unusual – but not entirely unexpected – step, cutting interest rates by 50 basis points (bps), rather than the usual 25, and is on track to successfully navigate a “soft landing” for the economy for the first time since 1995. The economy is showing resilience, the labor market remains stable, and inflation appears to be on a better path.
We’ll get into more detail shortly, but first, a look at the numbers year-to-date:

*Performance reflects index values as of market close on September 30, 2024. Bloomberg Aggregate Bond and MSCI EAFE reflect September 27, 2024, closing values.
U.S. economy continues to normalize
After last month’s surprising downward revision to employment numbers spanning from 2023 to early 2024, nonfarm payrolls for August were worse than expected at 142,000 new jobs – still strong compared to historical averages but a signal that the U.S. labor market is continuing to normalize. The job openings report was also lower than expected, and June’s numbers were revised lower, bringing job openings closer to pre-pandemic levels. At the same time, unemployment ticked down to 4.2% from 4.3% in July.
The services sector continued to expand in August, helping reduce market concerns about the strength of the U.S. economy. Manufacturing has struggled, but lower interest rates may help the sector out of its slump. Housing starts and building permits were higher than expected in August, and builders have accelerated completions, which increased by 9.2% from July to August and 30.2% year-over-year.
Market leadership broadens
While large companies continued to gain in value, small- and mid-size companies saw the strongest returns for the month, underscoring the importance of maintaining in a diversified portfolio. The Technology sector is still settling following its outsized performance earlier in the year, while interest rate-sensitive Utilities and Real Estate sectors are enjoying their time in the limelight. Two out-of-favor areas have perked up in the last week – Consumer Discretionary, thanks to the Fed’s rate cut, and Materials because of China’s strength due to policy measures intended to perk up the nation’s rocky position.
Long-term yields up, short-term down following rate cut
After the Fed’s September rate cut, the latest Federal Open Market Committee (FOMC) signaled an additional 50 bps in rate cuts by the end of the year and another 100 bps in 2025. Intermediate and long-term Treasury yields ultimately rose following the cut, steepening the curve. As expected, short-term yields fell in the leadup to the rate cut and in the days following: the one-year yield has fallen 73 bps since the beginning of August while the 10-year yield is down by just 21 bps. Bloomberg calculations are estimating 75 bps of cuts across the FOMC’s remaining two meetings this year.
Muni-to-Treasury ratios are near their highest levels of the year, with the 10-year ratio at about 70% and the 30-year around 85%.
Utility sector soars
As the Fed cut interest rates and the 10-year Treasury yield came down to 3.7% in September, investors began to feel more comfortable about companies that are more reliant on external funding. The Utility sector, which is famously rate sensitive, set an all-time high last month, surpassing the previous high from 2022. Utilities and independent power producers are also benefiting from the sentiment surrounding the AI boom given that the data center buildout is starting to provide a meaningful boost to electricity demand.
Important legislation excluded during "China Week"
While the House of Representatives spent significant energy on China-related policy earlier this month, several impactful and long-anticipated pieces of legislation were excluded from votes. Among them: provisions that would apply further scrutiny of U.S. investment into key Chinese tech, place new restrictions on data centers and reform the abilities of Chinese companies to import products into the U.S. duty-free via de minimis exemptions.
September also saw fears of a government shutdown averted, with Congress passing a compromise “clean” stopgap bill that funds the government through December 20. Legislators will now be directing their attention to the annual defense policy bill.
ECB cuts rates, UK holds steady
The European Central Bank (ECB) cut all key regional rates in September, a necessary move, according to President Christine Lagarde, because adjusted forecasts show inflationary pressures decelerating further over the bank’s two-year time horizon. Lagarde stressed that regional commercial bank lending conditions are still restrictive and expected to remain so for the near future. In contrast to the ECB, the UK’s Bank of England maintained the country’s base rate of interest at 5.0%, voting by a wide 8-to-1 margin not to loosen monetary conditions for the second time in as many meetings.
Following the backlash against its decision to raise interest rates in July, the Bank of Japan voted to not raise them again during its September rate-setting meeting.
The biggest news across international markets this month was the People’s Bank of China (PBoC) announcing broad stimulus measures in the country’s latest effort to halt persistent weakness in the real estate sector. The PBoC confirmed that it will set up a facility providing stockbroking firms, investment funds and insurance companies access to central bank liquidity specifically for the purchase of domestic equities.
The bottom line
While it’s good to see the broadening of the market and the lowering of interest rates excites investors, plenty of variables could spark volatility in the weeks and months ahead, including the health of the economy, employment and Fed messaging.
Investing involves risk, and investors may incur a profit or a loss. All expressions of opinion reflect the judgment of the Raymond James Chief Investment Officer and are subject to change. There is no assurance the trends mentioned will continue or that the forecasts discussed will be realized. Past performance may not be indicative of future results. Economic and market conditions are subject to change. Diversification does not guarantee a profit nor protect against loss. The Dow Jones Industrial Average is an unmanaged index of 30 widely held stocks. The NASDAQ Composite Index is an unmanaged index of all common stocks listed on the NASDAQ National Stock Market. The S&P 500 is an unmanaged index of 500 widely held stocks. The MSCI EAFE (Europe, Australasia and Far East) index is an unmanaged index that is generally considered representative of the international stock market. The Russell 2000 is an unmanaged index of small-cap securities. The Bloomberg Barclays US Aggregate Bond Index is a broad-based flagship benchmark that measures the investment grade, U.S. dollar-denominated, fixed-rate taxable bond market. An investment cannot be made in these indexes. The performance mentioned does not include fees and charges, which would reduce an investor’s returns. Companies engaged in business related to a specific sector are subject to fierce competition and their products and services may be subject to rapid obsolescence. There are additional risks associated with investing in an individual sector, including limited diversification. A credit rating of a security is not a recommendation to buy, sell or hold the security and may be subject to review, revision, suspension, reduction or withdrawal at any time by the assigning Rating Agency. Bond prices and yields are subject to change based upon market conditions and availability. If bonds are sold prior to maturity, you may receive more or less than your initial investment. Income from municipal bonds is not subject to federal income taxation; however, it may be subject to state and local taxes and, for certain investors, to the alternative minimum tax. Income from taxable municipal bonds is subject to federal income taxation, and it may be subject to state and local taxes. Investing in commodities is generally considered speculative because of the significant potential for investment loss. Their markets are likely to be volatile and there may be sharp price fluctuations even during periods when prices overall are rising. International investing involves special risks, including currency fluctuations, differing financial accounting standards, and possible political and economic volatility. The Consumer Price Index is a measure of inflation compiled by the US Bureau of Labor Studies. The Leading Economic Index (LEI) provides an early indication of significant turning points in the business cycle and where the economy is heading in the near term. This is not a recommendation to purchase or sell the stocks of the companies pictured/mentioned. Investing in small-cap stocks generally involves greater risks, and therefore, may not be appropriate for every investor. The prices of small company stocks may be subject to more volatility than those of large company stocks. The Nikkei 225 is a stock market index is for the Tokyo Stock Exchange (TSE). It is the most widely quoted average of Japanese equities. Sector investments are companies engaged in business related to a specific sector. They are subject to fierce competition and their products and services may be subject to rapid obsolescence. There are additional risks associated with investing in an individual sector, including limited diversification.
Material created by Raymond James for use by its advisors.
Profits and Stocks
First Trust Monday Morning Outlook
Brian S. Wesbury - Chief Economist
Robert Stein, CFA - Dep. Chief Economist
September 30, 2024
Like it does once every year, last week the Commerce Department went back and revised its GDP figures for the past several years. And while the top line revisions to Real GDP were pretty small, there was a larger revision to corporate profits.
Real GDP was revised up 1.3% for the second quarter of 2024, which means the annualized growth rate since the start of 2020 was about 0.3 percentage points faster than previously estimated: 2.3% per year rather than 2.0%.
And the statisticians also said profits were underestimated. The government now thinks its comprehensive national measure of pre-tax corporate profits is 11.5% higher than previously thought, mostly due to profits at domestic non-financial companies (such as manufacturers, retailers, transportation & warehousing, etc.). Meanwhile, after-tax profits were revised up 13.3%.
As our readers know, we judge the value of the overall stock market by using a Capitalized Profits Model. Using these revised economy-wide profits from the GDP accounts and a 10-year yield of 3.75% (Friday’s close) suggests the S&P 500 would be fairly valued at about 4,725, 18% below Friday’s S&P 500 close.
Our readers know that this measure is a view from 30,000 feet. The Capitalized Profits Model is not a trading model and there are many other tools to judge the value of stocks. In addition, in an election year, another factor is in play as well and that is the tax rate on corporate profits.
In 2018 the top tax rate on corporate profits was cut from 35% to 21%. This 21% tax rate is the lowest tax rate on corporate profits since the Great Depression.
We have always used pre-tax profits to judge stock values because the corporate tax rate moves up and down with the political cycle and pre-tax profits are a true reflection of economic activity, not just tax rate changes.
Clearly, the stock market has continued to rise in spite of the fact that our 30,000-foot view suggests it is overvalued. This could be a repeat of what happened in the late 1990s, when stocks rose in spite of the fact that they were overvalued, or it could be explained by an expectation that tax rates will stay low, and possibly be cut again.
Using newly revised after-tax profits in our model, instead of pre-tax profits, suggests that stocks are fairly valued today. And if President Trump were to win the election, and cut the corporate tax rate further as he has suggested (to 15%, from 21%) then there’s a case for stocks being mildly undervalued. (In theory, cutting the tax rate to 15%, which means companies would get to keep 85 cents on the dollar rather than 79 cents, translates into an 8% increase in after-tax profits).
However, there is also a risk of corporate tax increases, both in the near future as well as beyond. Vice President Harris’s campaign has mentioned lifting the rate to 28%, which would translate into a 9% reduction in after-tax profits.
It is hard to look at the federal budget situation and think the US government won’t be raising tax rates in the future. We’d prefer spending cuts, but we don’t live in a world where policymakers do what we want. In a worst-case scenario, tax rates could go up on both corporate profits as well as investors’ capital gains.
Net, net, what does this all mean? At the very best, upward revisions to profits mean stocks aren’t as overvalued as our models showed before. Nonetheless, with the M2 measure of the money supply down from its 2022 peak, and the risk of recession higher than it has been in a long time, we still believe stocks are overvalued.
The Federal Reserve is reducing interest rates, but even with a 10-year yield of 3% the stock market is not cheap. From 2008 to 2022, the market was significantly undervalued, and we were bullish for almost that entire time. Today, this is just not the case. There are sectors of the market that remain less expensive than the market as a whole, but caution is still warranted.

The attached information was developed by First Trust, an independent third party. The opinions are of the listed authors at First Trust Advisors L.P, and are independent from and not necessarily those of RJFS or Raymond James. All investments are subject to risk. There is no guarantee that these statements, opinions, or forecasts provided in the attached article will prove to be correct. Individual investor's results will vary. Past performance does not guarantee future results. Forward looking data is subject to change at any time and there is no assurance that projections will be realized. Any information provided is for informational purposes only and does not constitute a recommendation. Investing involves risk and you may incur a profit or loss regardless of strategy selected.
The Budget Blowout
First Trust Monday Morning Outlook
Brian S. Wesbury - Chief Economist
Robert Stein, CFA - Dep. Chief Economist
September 23, 2024
With only one week left in the fiscal year, it looks like the budget deficit for the federal government for Fiscal Year 2024 is going to come in at about $1.9 trillion, which is 6.7% of GDP.
To put this in historical perspective, we know of no other year in US history where in the absence of a major full-mobilization war (like World War I or II) or a major recession and its immediate aftermath when the budget deficit was so large. Some may point out that the budget gap was this large in FY 2012, a few years after the Financial Panic and Great Recession of 2008-09. However, the unemployment rate averaged 8.3% that year, more than double the average jobless rate of 4.0% this year. In other words, the economy in 2012 was still far from a full GDP and job-market recovery.
You may not remember, but Democrats hammered Ronald Reagan for deficits in the 1980s. Well, looking back the largest deficit we ever had under Reagan was in 1982, when the unemployment rate was 10% and we were fully funding the Pentagon at the height of the Cold War. In other words, there is simply no excuse for running a deficit this large given the lack of a major war and the absence of a recession.
And yet here we are. What’s amazing is how much the budget situation has changed in only the past five years. When looking at the budget it’s important to compare apples-to-apples, so we like to use the budget at the same point in the business cycle. In 2019 the economy was at a pre-COVID peak and 2024 is, so far, a peak business-cycle year as well. (It remains to be seen if 2025 is an even higher peak, in which case we will be happy to make a 2019 versus 2025 comparison a year from now).
Five years ago, in FY 2019, the deficit was 4.6% of GDP, so with this year at 6.7% it is 2.1 percentage points higher. Is it higher because of less revenue? Not at all. In the past five years revenue as a share of GDP has risen to 17.2% from 16.3%. They were $3.5 trillion in 2019, this year they are $4.9 trillion, $1.4 trillion higher.
Instead, the problem with the growing deficit is on the spending side. And while many just chalk it up to Social Security and Medicare because of our aging population, this just isn’t true. There are three major factors: (1) net interest on the federal debt, (2) “other” mandatory spending, and (3) major health care programs, such as Medicare (for senior citizens) and Medicaid (for those with lower incomes).
The growth in the net interest on the federal debt has been astounding and we plan to write more about the major political and policy implications of that change in the months ahead. Back in 2019, net interest was 1.8% of GDP; this year it will clock in at 3.1% of GDP, the highest share since 1995.
Meanwhile, “other” spending is up because the Biden Administration has been busy finding ways to forgive as many student loans as it can legally get away with (as well as ways that may end up being illegal, like with policy changes announced in 2022 and later overturned by the Supreme Court). When loans are forgiven, the Department of Education calculates present value of less future repayments, and factors that into the current budget year. As a result, “other” spending, which was 2.7% of GDP in 2019 is 3.8% this year.
Then there are the health care programs, which cost 5.3% of GDP five years ago, but 5.8% this year, with Medicaid growing much faster than Medicare. With population aging and barring major reforms to these programs, this share should only grow in the decade ahead.
The bottom line is that the US faces big structural budget challenges in the years ahead, particularly on the spending side. With low interest rates in the past fifteen years, we had the chance to avert our eyes from the problem, but we are soon to run out of time. No matter who we elect in November, we expect getting our fiscal house in order to eventually become a major policy theme of the next Administration as well as those beyond.

The attached information was developed by First Trust, an independent third party. The opinions are of the listed authors at First Trust Advisors L.P, and are independent from and not necessarily those of RJFS or Raymond James. All investments are subject to risk. There is no guarantee that these statements, opinions, or forecasts provided in the attached article will prove to be correct. Individual investor's results will vary. Past performance does not guarantee future results. Forward looking data is subject to change at any time and there is no assurance that projections will be realized. Any information provided is for informational purposes only and does not constitute a recommendation. Investing involves risk and you may incur a profit or loss regardless of strategy selected.
Dollars and Sense: Teaching Financial Literacy Early Pays Off

Raymond James
Family & Lifestyle
Discover money lessons that set children up for success.
In no uncertain terms, youth who participate in early financial literacy programs make better financial decisions later in life. Based on 76 empirical studies across 33 countries, the Financial Industry Regulatory Authority (FINRA) and National Endowment for Financial Education (NEFE) established that financial education programs have significant positive impact on both financial knowledge and financial behaviors.
Yet, as of last year, only 23 states require financial literacy education for high school graduation.
There’s a gap that needs to be filled – and one that parents and grandparents are well-equipped to bridge.
Proof is in the piggy bank
Arguably, money management skills are just as important for a child to gain as healthy eating habits and good manners. Financial literacy fosters positive behaviors that last a lifetime.
Research shows people with higher levels of financial literacy are more likely to spend less of their income, establish an emergency fund and open a retirement account than those with lower levels of financial knowledge. Those required to take personal finance classes make better college funding choices, have better credit scores and a higher net worth on average.
There are also surprising benefits of learning money management early on. According to research recently published in the Journal of Family Issues, those who indicated learning financial literacy from parents during their youth tended to enjoy more flourishing romantic relationships into adulthood. Healthy financial habits lead to less stress about money, putting less pressure on relationships.
Depending on your child’s age, financial literacy involves learning concepts like needs vs. wants, budgeting, saving, earning money, giving back and even investing. While it may be tempting to jump right into the financial topics that are top of mind for you, remember that this process is about building strong foundations for your child’s financial future and instilling confidence in their own financial independence. A lecture about the difference between an IRA and Roth IRA can come later.
Even if your child is learning about financial management in school, studies show that parents are the most influential source of financial learning. Overt financial teaching that extends into emerging adulthood drives financial literacy.
When (and how) to start
Experts say it’s never too early to start talking about finances as long as the conversations are age appropriate. Simple lessons woven into everyday life can be made fun with a little effort.
To identify essential money lessons that are suitable for your child, seek natural opportunities to introduce financial knowledge. For instance:
Five-year-olds: Discuss the difference between needs and wants while shopping at the grocery store.
Eight-year-olds: Ask your child to figure out the right combination of dollars and coins to pay for the shirt you’re purchasing.
Eleven-year-olds: Reinforce the importance of saving money and delayed gratification, especially as they desire more expensive items like a smartphone or video game system.
Thirteen-year-olds: Explore their job interests, research requisite schooling and skills, and compare salaries.
Sixteen-year-olds: Talk about their preferred brands and have them consider which stocks have growth potential.
Don’t be afraid to be transparent about the household financial activities and involve your children. These everyday decisions serve as real-time and relevant lessons in finance. Start with small, tangible tasks. For instance, if you’re taking a family road trip, you could ask for help allocating the snack budget at each stop.
Allowance remains a much-debated topic when it comes to financial learning. While some studies show allowances instill responsibility, others believe they lead to entitlement and decrease intrinsic motivation. If allowance is tied to chores or jobs, this can teach children the relationship between work and reward. It also empowers children to make independent choices when spending their hard-earned money. Apps like BusyKid and Greenlight let you assign dollar amounts to specific tasks and manage allowances together.
Pro tip: As your child or grandchild gets older, consider upgrading their piggy bank. There’s a real, working ATM from Lakeshore Learning that allows kids to create a savings goal and keep track of their balance.
Gamification of money topics
Though finance is a serious subject, lessons don’t need to be all too serious. When introducing money talk, think about how best to keep your children or grandchildren engaged in the topic.
Gamification not only makes learning fun but also makes lessons stick – because you’re practicing the skills you’ve learned, some might say, by “hiding” them in play. Beyond fun, gamifying learning offers several benefits: Setting clear goals in the game creates a growth mindset, and enjoying the object of the game fosters intrinsic motivation. Playing these games together also makes money an acceptable social topic, which lays the foundation for discussions about finances into adulthood.
The classic money games, like Monopoly and The Game of Life, are still great teachers but there are so many more resources out there now for kids to immerse themselves in these lessons. The US Mint website offers a variety of fun digital games for kindergartners through sixth graders. The Stock Market Game, which is geared for an older cohort, simulates the stock market and gives participants a virtual $100,000 portfolio to manage. Mycreditunion.gov offers digital resources, like Hit the Road, a financial adventure game in which the player determines how to spend their money during a cross-country trip.
If family game night is more your style, Money Bags is an exciting game that teaches basic money skills using fake currency. Players collect, count and exchange money on the game board. Exact Change is reminiscent of Uno, but with cards that have currency values. The game encourages players to be creative about making exact change. And The Allowance Game explores the concepts of earning money for completed chores and choosing what to spend it on.
Reinforcing concepts
No matter how you choose to teach your child or grandchild about finances, make it a goal to keep them engaged in learning and willing to discuss money with you. As adults, we’ve all had our share of lessons and mistakes, and this is an opportunity for your child to practice before the stakes are higher.
Encourage your children to get involved with school programs that offer opportunities to learn about money topics, like Junior Achievement BizTown. Consider financial literacy books for kids. For children aged 3 to 7, the classic Berenstain Bears series offers a few titles about money, including “Dollars and Sense” and “Trouble with Money.” As they grow older, middle schoolers can explore more advanced reads like “How to Turn $100 into $1,000,000,” which provides both inspiration and practical advice on earning money from a job or starting a business.
Initiating money conversations early on is a crucial step in shaping children’s financial understanding and responsibility. Encourage transparent discussions about money and support age-appropriate learning to foster confident, financially responsible adults.
Dos and don’ts of financial literacy lessons
Do help your children set up a savings plan early in life. This teaches delayed gratification and the power of compound interest.
Don’t assume your children are too young to discuss money. Scale lessons to their understanding, but it’s never too early to start.
Do try multiple teaching methods. Have conversations, read books, play board games and check out digital resources.
Don’t use money as a reward or punishment. Research shows it can decrease motivation and generosity.
Do set a good example and explain your financial decisions. This increases the likelihood kids will adopt similar practices.
Don’t be afraid to admit past mistakes. This will help your children avoid the same pitfalls.
Sources: finrafoundation. org; endseclusion.org; news. byu.edu; files.eric.ed.gov; blog. brainpop.com; mycreditunion.gov; parents.com; freedomsprout.com; financialeducatorscouncil.org; nces. ed.gov; brightchamps.com
Why Work With a Financial Advisor?

Raymond James
Retirement & Longevity
A professional advisor can craft a tailored, holistic financial plan that supports your needs, goals and intentions for the future.
Choosing to work with a financial advisor can make a positive difference in your current and future life – and even for the next generations of your family. Your goals of building and preserving wealth, enjoying a comfortable retirement and leaving a legacy are dependent on how well your financial matters are managed. Let’s delve into the details of what an advisor can bring to the table.
A personal relationship
Establishing a trusted professional relationship with a financial advisor can bring clarity to your financial future, simplify your financial life and bring a newfound sense of confidence regarding all investment matters.
By getting to know you, your aspirations and your current financial situation – and all of its details and complexities – your advisor can be in step with your life, advising you at every transition and turning point you encounter along the way.
Whether it’s paying for a child’s or grandchild’s education, giving to your favorite charities, transferring wealth to the next generation of your family, selling a business or making sure you have the care you need as you age, a personalized plan takes into account all of your goals.
Your advisor can also serve as your sounding board and voice of reason, guiding you in making prudent financial decisions and helping you avoid missteps that could harm your long-term progress.
Sophisticated strategies
Financial planning goes beyond just managing your investments. Certainly, your portfolio needs to fit your goals, risk tolerance and time horizon, but a comprehensive financial plan considers all aspects of your financial life all the way through and beyond retirement.
Your advisor should have access to a sophisticated suite of products and services designed to address even the most complex financial needs. They can leverage the insights of professionals from research analysts and investment strategists to specialists in trust and estate planning, charitable giving strategies, cash and lending solutions, insurance protection, business services and more.
Your advisor can also help you identify appropriate financial strategies while collaborating with your tax and legal professionals – designed for a seamless approach to managing and preserving wealth.
Having a real person who you build a trusted relationship with, understands complex financial needs, is in step with your life and empathizes with your goals, needs and concerns is not something that can be easily replicated.
Tailored advice
It’s important to remember that the advice you receive is personalized to you by an advisor who understands you and your family and cares about your financial well-being. Having a trusted financial partner there to guide you and help make objective recommendations that are in your best interest can prove to be invaluable.
When it comes to the important financial matters in your life, receiving generic advice that could apply to anybody will not serve you well. Your life and wealth needs are multifaceted, and they merit professional guidance that is customized accordingly.
Time to get started
The professional support provided by an advisor can help you navigate even your most complex financial needs while freeing you to spend time on the things – and the people – that matter most to you. Having an introductory meeting to determine if there is a good mutual fit would be a valuable first step.
Lending services provided by Raymond James Bank, member FDIC, affiliated with Raymond James Financial Services and Raymond James & Associates, Inc. Insurance products offered through Raymond James Insurance Group, an affiliate of Raymond James & Associates, Inc. and Raymond James Financial Services, Inc. You should discuss any legal matters with the appropriate professional
Federal Reserve Cuts Interest Rates for First Time in Four Years

Raymond James
Markets & Investing
September 18, 2024
The half-percentage point reduction at the September 17-18 FOMC meeting represents the largest non-COVID era cut by the Fed since 2008.
The Federal Reserve (Fed) cut interest rates for the first time in over four years, moving its benchmark rate 0.50% lower to support the labor market, while working toward its 2% inflation target.
The much-anticipated announcement came on September 18, at the conclusion of the two-day Federal Open Market Committee (FOMC) meeting. The rate cut lowers the federal funds target range to 4.75%-5.00%, and excluding COVID-era cuts, is the largest reduction by the Fed since 2008.
“The Fed’s policy shift is clear: Its focus is squarely on economic growth, particularly employment conditions, and less on inflation,” said Raymond James Chief Investment Officer Larry Adam.
In addition to the meeting decision, the FOMC released its updated Summary of Economic Projections (SEP) and dot plot, where it forecasts up to another 0.50% of cuts by the end of 2024 and up to a full percentage point of decreases in 2025. For over a year, the FOMC held the benchmark federal funds rate at 5.25%-5.50%, following its last rate hike in July 2023.
“Interestingly, the Fed’s GDP forecast is almost unchanged compared to the June forecast while the inflation forecast came in lower,” noted Raymond James Chief Economist Eugenio Alemán. “Meanwhile, the forecast for the rate of unemployment was higher than in June. It seems that the Fed believes that the labor market will not continue to deteriorate much from where we are now, as it expects the unemployment rate to stay at 4.4% in 2025.”
The Fed’s GDP growth forecast on a year-over-year basis remained almost unchanged. In the June projection, the SEP expected growth was 2.1% while the new forecast expects growth of 2.0%, with 2025 and 2026 remaining at 2.0% for the median forecast.
The SEP rate of unemployment was a bit higher, at 4.4% in 2024, compared to June’s projection for a 4.0% rate. The Fed also expects an unemployment rate of 4.4% in 2025, up from 4.2% in June. For 2026, it expects the rate of unemployment to drop to 4.3% versus the 4.1% estimate in the June SEP.
“We’re trying to achieve a situation where we restore price stability without the kind of painful increase in unemployment that has come sometimes with disinflation,” said Fed Chair Jerome Powell in his post-meeting press conference.
Powell also noted that no one should look at the 0.50% cut as “the new pace.” The message from the Fed’s projected dot plot is that while the Fed will remain data dependent, the path of the fed funds rate will be fairly profound over the rest of 2024, 2025 and 2026 – taking the federal funds rate midpoint from the 5.38% prior to today’s meeting to 2.9% at the end of 2026.
“The number and size of rate cuts is less important than the actual impact lower interest rates have on the economy,” said Adam. “If the economy averts a recession, the equity market should maintain its upward path as earnings continue to grow. This is the first step in the Fed attempting to engineer a soft landing and preserve the current economic expansion, which should be, long term, market friendly.”
The next FOMC meeting takes place November 6-7.
All expressions of opinion reflect the judgments of the Raymond James Chief Investment Officer and Raymond James Chief Economist and are subject to change.
There is no assurance the trends mentioned will continue or that the forecasts discussed will be realized. Past performance may not be indicative of future results. Economic and market conditions are subject to change. Investing involves risk, and you may incur a profit or loss regardless of the strategy selected.
It’s Money, Not Spending, that Causes Inflation
First Trust Monday Morning Outlook
Brian S. Wesbury - Chief Economist
Robert Stein, CFA - Dep. Chief Economist
September 16, 2024
You don’t have to read or listen for long these days before you hear a politician, pundit, or politically-inclined person say: “Government spending causes inflation.”
Don’t get us wrong…anyone who wants to cut the size and scope of government is a friend of ours. Government is WAY too big. It slowed the growth rate of the economy, hurt living standards, and made people fight over fixed slices of the pie rather than working to grow the pie. But, government spending, itself, doesn’t cause inflation.
Just think about it. If government taxes (or borrows) $1,000 from Peter and gives that $1,000 to Pauline…Peter doesn’t have it, but Pauline does. Is there any more money in the economy? Absolutely not.
The only thing that can increase inflation – in fact, the definition of inflation – is excess money creation. Inflation is a decline in the purchasing power of a currency caused by central banks that inject more money into an economy than an economy really needs. Inflation isn’t an increase in the prices of goods and services, it’s a decline in the value of money. And government spending, all by itself, does not increase the money supply.
And if you don’t believe us, how about Milton Friedman? He wrote “Fiscal policy is extremely important in determining what fraction of total national income is spent by government and who bears the burden of that expenditure. By itself, it is not important for inflation.”
Some people wrongly assume that government borrowing creates money. But think about it. Who does the government borrow from? China, Japan, retirees, and banks all buy Treasury bonds. They buy them with dollars that they earned exporting to the US, working for incomes, or taking in deposits.
If any entity buys the debt of the US they no longer have the cash, the government does. Like Peter and Pauline, it is just a transfer of cash from one account to another. It doesn’t increase spending. If China buys debt, then they can’t buy imports with those same dollars. If banks buy debt, then they can’t make loans with that same money.
What is true is that if the Fed (or any central bank) creates new money (say with QE) and buys government debt, this injects new money into the economy. That IS inflationary. But it’s the money creation that caused the inflation, not the spending itself.
We think government spending needs to be cut. In fact, it may be the most important policy proposal on the table today. But we should cut spending for the right reasons. Making mush of economics doesn’t help anyone in the long run.
In that vein, many people correctly point out that the more the government borrows and taxes, the less the private sector has. This slows the growth of the economic pie and holds back the production of goods and services. Fewer goods and services, with the same monetary policy, means higher prices than we would have if government were smaller.
But this is not inflation, it is a (negative) supply-side boost in prices. The Fed could pull money growth back in such a situation and keep prices from rising as much, but the Fed actually does the opposite. The slower the economy grows, the more likely the Fed is to print excess money to boost it.
Again, this excess money is what causes the inflation, not the government spending. Even though a bigger government holds back output, it is not the ultimate cause of inflation.
The US was able to fix the inflation of the 1970s by slowing down the growth rate of the money supply. And, contrary to popular belief, the US does not need easy money and low interest rates to grow. In fact, the high-tech sector has thrived with declining prices.
Let’s cut spending for the right reasons. We get it: if saying spending creates inflation and that bumper sticker argument gets voters on board it would be easy. But the real reason to cut the size of government is to create more of a free market, reduce corruption, and allow workers to keep more of what they earn.

The attached information was developed by First Trust, an independent third party. The opinions are of the listed authors at First Trust Advisors L.P, and are independent from and not necessarily those of RJFS or Raymond James. All investments are subject to risk. There is no guarantee that these statements, opinions, or forecasts provided in the attached article will prove to be correct. Individual investor's results will vary. Past performance does not guarantee future results. Forward looking data is subject to change at any time and there is no assurance that projections will be realized. Any information provided is for informational purposes only and does not constitute a recommendation. Investing involves risk and you may incur a profit or loss regardless of strategy selected.
Slower Faster
First Trust Monday Morning Outlook
Brian S. Wesbury - Chief Economist
Robert Stein, CFA - Dep. Chief Economist
September 9, 2024
Friday’s employment report suggests the US economy may be slowing down faster than most investors think.
Nonfarm payrolls increased 142,000 in August, but revisions to June and July brought the net gain down to a modest 56,000. And the details were worse. We like to follow payrolls excluding three sectors: government, education & health services, and leisure & hospitality, all of which are heavily influenced by government spending and regulation (that includes COVID lockdowns and re-openings for leisure & hospitality). That “core” measure of payrolls rose only 25,000 in August and is up only 31,000 total in the past three months.
In particular, government plus education & health care jobs have made up 37% of all the net payroll increases since the pre-COVID peak in February 2020, an unusually large share.
For August itself, things looked better if you focus on civilian employment, an alternative measure of jobs that includes small-business start-ups, which rose 168,000 for the month. However, it’s hard to make a strong case for the US economy if you stick with that civilian employment measure. The August gain was the largest in five months but civilian employment is down compared to a year ago, with a loss of 66,000 jobs. Even worse, full-time employment is down one million from a year ago while part-time employment is up 1.1 million over the same timeframe.
Another recent report from the Labor Department revised down the payroll increase in the year ending in March 2024 by 818,000. That makes sense given that payrolls had been previously estimated to have grown 2.9 million during this period while civilian employment was estimated to have grown 642,000. But even after reducing payroll growth by 818,000 that still leaves a large gap. One way to close that remaining gap is an upward revision to population numbers due to high immigration, which would lift civilian employment, as well. But another way would be an even larger downward revision to payrolls.
This week the Labor Department will report on inflation and we – and the consensus – expect a moderate 0.2% increase in consumer prices for the month of August. In turn, that would mean that CPI prices were up around 2.5% from a year ago, which should translate into PCE inflation (the Federal Reserve’s preferred measure) of 2.3%. That’s a big drop from the 3.3% gain in PCE prices in the year ending in August 2023 and suggests that by the early part of next year inflation may temporarily hit or go under the Fed’s 2.0% target.
Why is this happening? Why is the economy slowing and inflation decelerating? Because monetary policy has been tight. After surging in 2020-21, the M2 measure of the money supply peaked in early 2022. Although it’s been rising gradually since October, it’s still down 3.1% from the peak in April 2022.
The Fed obviously realizes this, hence all the talk about cutting short-term interest rates. For now, our base case is that the Fed will cut rates by a quarter percentage point at each of the three remaining meetings this year (starting next week) and continue that pattern well into 2025.
The problem is that the Fed still thinks its focus should be on rates, not the money supply. If growth in M2 picks back up quickly, we risk a return to higher inflation, like we did multiple times in the 1970s. If growth in M2 remains lackluster in spite of rate cuts, the landing could get harder than anyone thinks.

The attached information was developed by First Trust, an independent third party. The opinions are of the listed authors at First Trust Advisors L.P, and are independent from and not necessarily those of RJFS or Raymond James. All investments are subject to risk. There is no guarantee that these statements, opinions, or forecasts provided in the attached article will prove to be correct. Individual investor's results will vary. Past performance does not guarantee future results. Forward looking data is subject to change at any time and there is no assurance that projections will be realized. Any information provided is for informational purposes only and does not constitute a recommendation. Investing involves risk and you may incur a profit or loss regardless of strategy selected.
August Sees Markets Close Strong After Tough Start

Raymond James
Markets & Investing
September 3, 2024
A soft landing for the U.S. economy still appears to be the most likely outcome.
August brought a bit of whiplash for investors.
Markets fell at the beginning of the month, caught in the ripples of an interest rate increase in Japan disrupting a significant currency trading strategy. This led to a brief, intense global selloff.
In the U.S., the incident was aggravated by a weak jobs report with unemployment rising from 4.1% to 4.3% – which remains historically low, it’s worth noting. The report brought the U.S. into Sahm rule territory, a macroeconomic assessment which judges whether the economy is in recession based on unemployment rate increases. Additionally, several disappointing earnings releases created a sense of caution with investors over the health of the consumer.
“However, other data has been stronger, and a soft landing still appears to be the most likely outcome for the economy,” Raymond James Chief Investment Officer Larry Adam said. “For instance, retail sales for July were up a healthy 1% and the Consumer Price Index [CPI] showed that inflation is being tamed with three-month core CPI falling to an annualized rate of 1.6%. And the stage appears set for the Federal Reserve [Fed] to kick off an easing cycle, which should support broader participation and higher equity markets longer term.”
Toward the end of the month, Fed Chair Jerome Powell said “the time has come” for the Fed to adjust policy, a much-anticipated statement for those expecting interest rate cuts this year. Those remarks kicked off an equity market rally, with the S&P 500 ending the month up 2.3% and the Dow Jones Industrial Average hitting an all-time high.
We’ll dive into the details below, but first let’s look at the numbers year-to-date:
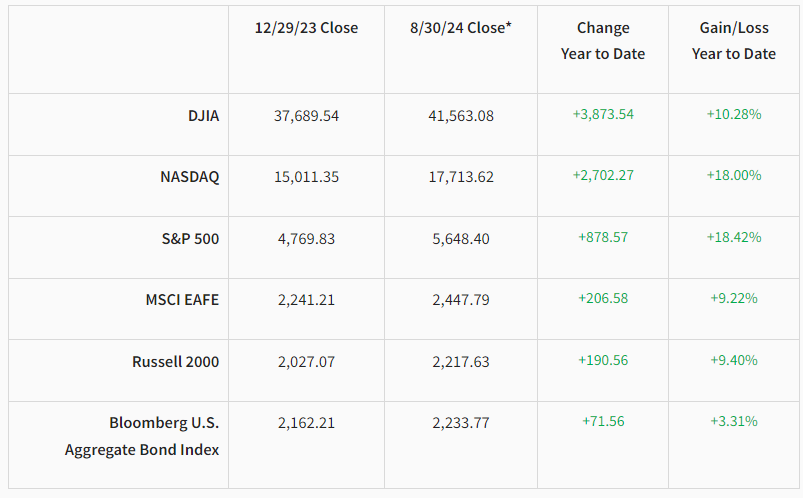
*Performance reflects index values as of market close on August 30, 2024. Bloomberg Aggregate Bond and MSCI EAFE reflect August 29, 2024, closing values.
Labor market weakens
The U.S. labor market has weakened, as suggested by data including a major revision of jobs reports spanning April 2023 to March 2024. The Bureau of Labor Statistics lowered estimates by 818,000 jobs, a 29% difference from preliminary estimates. Combined with the inflation rate continuing to decelerate, the weaker jobs numbers made the Fed’s path to lowering interest rates clearer.
S&P 500 rallies, but headwinds remain
The S&P 500 experienced a good rally – up 8% over eight days – affecting a wide range of stocks while volatility indicators remained low. This was supported by reassuring economic data, namely the third consecutive month of sub-0.2% core CPI increases and the uptick in retail sales. Headwinds remain, however, and August and September are typically the softest months of the year for stocks, so further volatility is to be expected.
An interesting dynamic developing in the S&P 500 is the subtle shift in market leadership. Defensive, interest-sensitive sectors like utilities, real estate and health care are at new highs, while the semiconductor group is down.
Treasury yields lower, rate cuts imminent
Treasurys rallied across the curve in August, bringing yields lower. One-year and two-year Treasury yields are down 35 basis points (bps) and 39 bps respectively, while the 10-year and 30-year yields are down 19 bps and 17 bps.
Fed Chair Powell’s statement from Jackson Hole indicated interest rate cuts are coming, with investors expecting two to three 25-bps cuts by the end of the year. Next year could deliver more than 200-plus bps cuts, bringing the yield curve to a more normal, upward slope.
Tech tension escalates
In its simmering trade conflict with China, the U.S. Congress is tightening control over tech exports, especially semiconductors, and seeking international support, particularly from the Netherlands and Japan. Expectations are high for new rules targeting high-performance memory chips while the Commerce Department is considering new restrictions on AI memory chips, which could impact major tech companies’ ability to sell to China.
Oil demand high, despite headwinds in China
Oil prices are down as the summer driving season comes to an end, prompting OPEC to extend production cuts. Global demand is at a record high in 2024, 3% over pre-COVID-19 levels, but is still less than oil producers hoped for early in the year. Among the reasons: China, the world’s largest oil importer, has become the first major economy where electric vehicles have reached 50% of auto sales. Meanwhile, neither the conflict in Gaza nor the one in Ukraine has had any meaningful effect on oil supply.
Japan's economy reveals fragility, UK's shows resilience
The benchmark Nikkei 225 index plunged after the Bank of Japan raised interest rates on July 31, demonstrating the fragility of the Japanese economy and financial markets. While the market has since rebounded, the country’s economy continues to face significant headwinds, including an aging population and low domestic demand.
Bank of Japan Governor Kazuo Ueda defended the decision to raise interest rates, saying the market turmoil had more to do with concerns about the U.S. economy than Japan’s, while Finance Minister Shun’ichi Suzuki argued that higher interest rates could be detrimental to the Japanese economy.
The UK economy is showing some resilience, with a 0.6% growth in GDP in the second quarter and a strengthened pound sterling. With inflation slightly above its 2.2% target, the Bank of England cut interest rates by 0.25% to 5.00% – the first cut since the start of the pandemic. However, Finance Minister Rachel Reeves discovered a £22 billion shortfall in next year’s budget, which, along with pressure to increase wages in the public sector, could have a negative effect on inflation and economic growth.
The bottom line
As we remain in the weakest seasonal period of the year, investors may expect to see some back-and-forth trading ahead. Economic data and actions from the Fed will remain key influences to watch.
Investing involves risk, and investors may incur a profit or a loss. All expressions of opinion reflect the judgment of the Raymond James Chief Investment Officer and are subject to change. There is no assurance the trends mentioned will continue or that the forecasts discussed will be realized. Past performance may not be indicative of future results. Economic and market conditions are subject to change. The Dow Jones Industrial Average is an unmanaged index of 30 widely held stocks. The NASDAQ Composite Index is an unmanaged index of all common stocks listed on the NASDAQ National Stock Market. The S&P 500 is an unmanaged index of 500 widely held stocks. The MSCI EAFE (Europe, Australasia and Far East) index is an unmanaged index that is generally considered representative of the international stock market. The Russell 2000 is an unmanaged index of small-cap securities. The Bloomberg Barclays US Aggregate Bond Index is a broad-based flagship benchmark that measures the investment grade, U.S. dollar-denominated, fixed-rate taxable bond market. An investment cannot be made in these indexes. The performance mentioned does not include fees and charges, which would reduce an investor’s returns. Investing in the energy sector involves special risks, including the potential adverse effects of state and federal regulation, and may not be suitable for all investors. A credit rating of a security is not a recommendation to buy, sell or hold the security and may be subject to review, revision, suspension, reduction or withdrawal at any time by the assigning Rating Agency. Bond prices and yields are subject to change based upon market conditions and availability. If bonds are sold prior to maturity, you may receive more or less than your initial investment. Income from municipal bonds is not subject to federal income taxation; however, it may be subject to state and local taxes and, for certain investors, to the alternative minimum tax. Income from taxable municipal bonds is subject to federal income taxation, and it may be subject to state and local taxes. Investing in commodities is generally considered speculative because of the significant potential for investment loss. Their markets are likely to be volatile and there may be sharp price fluctuations even during periods when prices overall are rising. International investing involves special risks, including currency fluctuations, differing financial accounting standards, and possible political and economic volatility. The companies engaged in the communications and technology industries are subject to fierce competition and their products and services may be subject to rapid obsolescence. The Consumer Price Index is a measure of inflation compiled by the US Bureau of Labor Studies. The Leading Economic Index (LEI) provides an early indication of significant turning points in the business cycle and where the economy is heading in the near term. This is not a recommendation to purchase or sell the stocks of the companies pictured/mentioned. Investing in small-cap stocks generally involves greater risks, and therefore, may not be appropriate for every investor. The prices of small company stocks may be subject to more volatility than those of large company stocks. The Nikkei 225 is a stock market index is for the Tokyo Stock Exchange (TSE). It is the most widely quoted average of Japanese equities. Sector investments are companies engaged in business related to a specific sector. They are subject to fierce competition and their products and services may be subject to rapid obsolescence. There are additional risks associated with investing in an individual sector, including limited diversification.
Material created by Raymond James for use by its advisors.
